Abstract
The accurate and objective assessment of reinforced concrete structures is paramount for maintaining structural integrity and optimizing long-term maintenance planning. This study introduces a unified deep learning and computer vision framework designed for the automated detection, classification, and standards-aligned quantitative analysis of concrete cracks. The methodology begins with the automated categorization of an approximately 7,000-image concrete surface dataset into seven specific defect types including Thermal, Serviceability, and Strength Failure Cracks based on geometric metrics like crack length and width. This automated pre-classification step successfully mitigates the subjectivity and inconsistency associated with traditional manual labeling, providing a robust foundation for model training. A Convolutional Neural Network (CNN), implemented using Python, TensorFlow, and Keras, was trained over 50 epochs to detect and classify these categorized defects. The model achieved a final classification accuracy of 91.1%, demonstrating strong generalization and outperforming models trained on unrefined datasets. Following detection, a quantitative damage measurement module utilizes Otsu thresholding, morphological filtering, and skeletonization to precisely extract geometric parameters. Automated functions estimated key crack metrics, including length (5–180mm) and width (0.2–4.5mm), and surface deterioration percentage. These measurements are used to assign a severity grade (minor, moderate, or severe), aligned with established ACI 224R-01 and ACI 318-19 guidelines. Visualization techniques, such as severity-based color coding and multi-panel views, enhance the interpretability and validate both the detection accuracy and measurement reliability. By integrating automated data refinement, CNN-based recognition, and objective standards-aligned quantitative assessment, this framework provides a scalable and reliable tool for real-time structural health monitoring.
Keywords
Structural Health Monitoring, Convolutional Neural Network, Crack Detection, Crack Quantification,
Image Processing Techniques, Severity Grading Framework, Predictive Maintenance
1. Introduction
The structural integrity and serviceability of reinforced concrete (RC) infrastructure are critical for ensuring public safety, durability, and cost-effective maintenance throughout a structure’s life cycle. Concrete, despite its widespread use and high compressive strength, is inherently weak in tension and susceptible to cracking due to various mechanical, thermal, and environmental factors. Cracks often serve as early indicators of structural deterioration, enabling engineers to assess the severity of damage and predict future performance. Therefore, timely and accurate detection, measurement, and classification of cracks are essential for maintaining the reliability and safety of built infrastructure. Traditional crack inspection methods, including manual visual surveys and non-destructive testing (NDT) techniques such as ultrasonic or infrared thermography, remain the standard practice in the field. However, these methods are typically labor-intensive, subjective, time-consuming, and often impractical for large-scale or continuous monitoring. The increasing demand for efficient, objective, and scalable solutions has motivated researchers to adopt computer vision and deep learning–based frameworks for automated crack analysis. Convolutional Neural Networks (CNNs), in particular, have shown superior performance in recognizing complex visual patterns, enabling accurate detection and segmentation of surface defects in concrete structures.
While most existing studies focus primarily on crack detection and binary classification (cracked vs. non-cracked), fewer efforts have been directed toward quantitative crack measurement and standards-based severity classification, which are essential for structural assessment and maintenance prioritization. A critical gap remains in translating image-based crack features such as width, length, and depth into engineering-relevant severity levels consistent with design and inspection standards like the American Concrete Institute codes. This research contributes to the growing body of intelligent infrastructure monitoring systems by bridging the gap between AI-driven visual inspection and engineering code-based evaluation. By embedding ACI provisions directly into the classification logic, the framework enhances the interpretability, reliability, and practical usability of automated crack assessment, paving the way for data-driven maintenance planning and predictive structural health monitoring in modern civil infrastructure.
2. Literature Review
The detection and classification of concrete cracks using deep learning has evolved significantly over the past decade, transitioning from conventional image processing methods to advanced convolutional and transformer-based neural networks. This review provides a chronological and thematic overview of major developments in automated crack detection and severity classification, highlighting improvements in model architecture, feature extraction, computational efficiency, and dataset utilization. It also discusses how recent studies have integrated structural engineering standards into deep learning frameworks to enable quantitative crack severity assessment. Collectively, the reviewed works demonstrate the field’s progression toward real-time, scalable, and highly accurate structural health monitoring systems.
In 2019, Li et al.
| [1] | Bukaita, W., Vankudothu, K. N., Khan, J. (2025). Automated Multi-Class Concrete Crack Detection and Severity Classification Using CNN-Based Deep Learning. American Journal of Civil Engineering, 13(4), 197-210.
https://doi.org/10.11648/j.ajce.20251304.12 |
[1]
proposed a modified Net architecture to enhance crack detection performance under noisy and real-world conditions. By optimizing the learning rate and testing on high-resolution images not seen during training, they achieved improved validation accuracy and robustness. Their framework was later deployed within a smartphone application, demonstrating practical applicability for on-site inspections. Similarly, Zhang et al.
developed a context-aware deep convolutional segmentation network capable of processing arbitrarily sized images through a semantic segmentation approach. Their context-aware fusion mechanism enabled integration of local cross-state and cross-space features, substantially improving crack localization across diverse datasets.
In 2020, Park et al.
| [3] | Ren, Yupeng, Jisheng Huang, Zhiyou Hong, Wei Lu, Jun Yin, Leiun Zou, and Xiaohua Shen. 2020. “Image-based concrete crack detection in tunnels using deep fully convolutional networks.” Construction and Building Materials 234.
https://doi.org/10.1016/j.conbuildmat.2019.117367 |
[3]
integrated deep learning with structured light technology by combining the YOLO detection algorithm with a laser-based measurement system. Their system included a laser alignment correction module and a distance sensor, enabling real-time quantification of crack width and geometry. In the same year, Ren et al.
| [4] | Li, Shengyuan, Xuefeng Zhao, and Hayri Baytan Ozmen. 2019. “Image-based concrete crack detection using convolutional neural network and exhaustive search technique.” Advances in Civil Engineering 2019. https://doi.org/10.1155/2019/6520620 |
[4]
introduced CrackSegNet, an end-to-end fully convolutional network tailored for tunnel crack segmentation. Incorporating dilated convolutions, spatial pyramid pooling, and skip connections, their model enhanced multiscale feature extraction and outperformed earlier image processing and deep learning methods.
In 2021, Kim et al.
demonstrated that shallow CNN architectures, adapted from LeNet-5, can offer high accuracy while maintaining computational efficiency. Their results showed that lightweight models may rival deeper networks such as VGG16, Inception, and ResNet, especially in real-time monitoring scenarios involving low-power sensors. In 2022, Sales da Cunha et al.
| [6] | Zhang, Xinxiang, Dinesh Rajan, and Brett Story. 2019. “Concrete crack detection using context-aware deep semantic segmentation network.” Computer-Aided Civil and Infrastructure Engineering 34(11): 951–71.
https://doi.org/10.1111/mice.12477 |
[6]
compared traditional machine learning with CNN-based methods and found that for small datasets (≤100 images), conventional texture-based techniques could outperform CNNs, although deep learning models scaled more effectively with larger datasets. Golding et al.
| [7] | Hang, Jiaqi, Yingjie Wu, Yancheng Li, Tao Lai, Jie Zhang, and Yang Li. 2023. “A deep learning semantic segmentation network with attention mechanism for concrete crack detection.” Structural Health Monitoring.
https://doi.org/10.1177/147592172311216710 |
[7]
also explored the role of color information in crack detection, discovering that grayscale images preserved accuracy while reducing computational cost when using a pretrained VGG16 network.
The same year, Wan et al.
| [8] | Kim, Bubryur, N. Yuvaraj, K. R. Sri Preethaa, and R. Arun Pandian. 2021. “Surface crack detection using deep learning-based shallow CNN architecture for enhanced computation.” Neural Computing and Applications 33(15): 9289–9305. https://doi.org/10.1007/s00521-021-05950-4 |
[8]
proposed a single-shot multibox detector (SSD) integrated with a sliding-window approach and an eight-neighborhood algorithm to improve detection precision on portable devices. Joshi et al.
| [9] | Arfan, Palisa, AHM Muntasir Billah, and Tahsin Reza. 2024. “Deep learning-based concrete defects classification and detection using semantic segmentation.” Structural Health Monitoring 23(2): 383–409.
https://doi.org/10.1177/14759217231158114 |
[9]
leveraged Mask R-CNN to achieve simultaneous crack detection and segmentation, attaining high mean average precision (mAP) on a dataset of 3,000 annotated images. Geetha et al.
| [10] | Golding, Vaughn Peter, Zahra Gharineiat, Suliman Munawar Hafiz, and Fahim Ullah. 2024. “Crack classification and quantification using deep learning.” Sustainability 14(4): 8147. https://doi.org/10.3390/su14138117 |
[10]
advanced pixel-level crack classification using an efficient hybrid method combining image binarization with a Fourier-based 1D classifier, demonstrating viability for deployment on low-computation hardware supported by t-SNE-based visual explainability.
In 2023, Wang et al.
| [11] | Wan, Chunfeng, Xiaobin Xiong, Bo Wen, Shuai Gao, Da Fang, Caigian Yang, and Songtao Xue. 2022. “Crack detection for concrete bridges with image-based deep learning.” Science Progress 105(4). https://doi.org/10.1177/00368504221128487 |
[11]
introduced CrackSN, a lightweight network based on Adam–SqueezeNet optimization that effectively extracted discriminative features from augmented image patches. Hang et al.
| [12] | Yu, Shanshan, Jian Zhang, Chengpeng Zhu, Zeyang Sun, and Shuai Dong. 2024. “Full-field deformation measurement and cracks detection in speckle scene using the deep learning-aided digital image correlation method.” Mechanical Systems and Signal Processing 209.
https://doi.org/10.1016/j.ymssp.2024.111131 |
[12]
developed an attention-based fusion network using a ResNet101 backbone, incorporating dual attention mechanisms to capture multiscale crack details in both vertical and horizontal orientations. Yu et al.
| [13] | Lin, Wang. 2023. “Automatic detection of concrete cracks from images using Adam-squeezenet deep learning model.” Fracture and Structural Integrity 17(65): 289–99.
https://doi.org/10.3221/IGF-ESIS.65.19 |
[13]
addressed geometric distortion issues using a Perspective-n-Point (PnP) method combined with surface mapping and random speckle markers to correct homographic deformation and thickness estimation.
Building on transformer-based innovation, Qingyi and Chen Bo (2024)
| [14] | Kolappa, Geetha Ganesh, and Sung-Han Sim. 2022. “Fast identification of concrete cracks using 1D deep learning and explainable artificial intelligence-based analysis.” Automation in Construction 143.
https://doi.org/10.1016/j.autcon.2022.104572 |
[14]
introduced a transformer crack detection framework enhanced with receptive field attention modules and adaptive loss functions, significantly improving multiscale feature representation. During the same period, Arafin et al.
curated a large-scale dataset involving crack and spalling detection and benchmarked leading architectures including VGG19, ResNet50, InceptionV3, U-Net, and PSPNet, offering insights into the performance trade-offs among segmentation-focused models.
Most recently, substantial progress has been made in 2025 through several advanced frameworks. Bukaita et al.
| [16] | American Concrete Institute. 2001. ACI 224R-01: Control of Cracking in Concrete Structures. Farmington Hills, MI: American Concrete Institute. |
[16]
proposed an automated deep learning architecture for multi-class crack detection and severity classification using a custom CNN with four convolutional blocks, achieving 94.7% accuracy on a 21,000-image dataset aligned with ACI 318-19 and ACI 224R-01 severity standards. Their integration of engineering codes with deep learning marked a critical advancement toward reliability and field applicability.
Additionally, emerging research has expanded beyond vision-based detection into predictive structural health analytics. Patel and Bukaita
| [18] | Patel, Hetkumar, and Wisam Bukaita. 2025. “Deep Learning-Based Prediction of Lifespan Degradation in Concrete Bridges Due to Iron Oxidation.” American Journal of Traffic and Transportation Engineering 10(5).
https://doi.org/10.11648/j.ajtte.20251005.11 |
[18]
introduced a deep learning model designed to predict lifespan degradation in concrete bridges affected by iron oxidation. Their approach demonstrated how temporal deterioration patterns can be quantitatively modeled to forecast long-term structural decline. Similarly, Bukaita et al.
| [1] | Bukaita, W., Vankudothu, K. N., Khan, J. (2025). Automated Multi-Class Concrete Crack Detection and Severity Classification Using CNN-Based Deep Learning. American Journal of Civil Engineering, 13(4), 197-210.
https://doi.org/10.11648/j.ajce.20251304.12 |
[1]
advanced multi-class crack severity classification using CNN-based architectures, emphasizing accurate categorization across numerous severity levels. Complementing these CNN-based studies, Bowling, Pierini, and Bukaita
| [19] | Bowling, Carson, Luke Pierini, and Wisam Bukaita. 2025. “Deep Learning-Based Severity Classification of Concrete Cracks Using YOLOv8 for Structural Health Analysis.” Global Journal of Researches in Engineering, September.
https://doi.org/10.34257/LJERVOL25IS3PG13 |
[19]
developed a YOLOv8-based severity classification model that enhanced detection precision and processing speed, underscoring the growing role of high-performance real-time object detection frameworks in structural health monitoring.
Together, these studies illustrate a clear trajectory in the field from early CNN-based crack detection to sophisticated transformer models, multimodal sensing approaches, and predictive analytics integrating material degradation mechanisms. The incorporation of engineering standards, larger curated datasets, and real-time detection frameworks signifies a maturing research landscape that is increasingly capable of delivering practical, scalable solutions for infrastructure inspection and long-term structural health assessment.
3. Methodology
This study adopts a quantitative, deep learning–based methodology to automatically detect, measure, and classify cracks in reinforced concrete structures according to their physical dimensions and severity. The framework integrates Convolutional Neural Networks (CNNs)
3.1. Dataset Acquisition and Preprocessing
High-quality image data are essential for developing a reliable crack detection model. Therefore, this study employs open-source and publicly available repositories containing high-resolution images of reinforced concrete surfaces exhibiting various crack patterns, illumination conditions, and background textures. The inclusion of diverse datasets enhances model generalization and robustness.
Prior to model training, each image undergoes a structured preprocessing pipeline to improve feature clarity and reduce data noise:
1) Noise Reduction: Gaussian and median filters are applied to suppress high-frequency noise and eliminate pixel-level irregularities introduced by sensors or environmental lighting.
2) Contrast Enhancement: Adaptive histogram equalization is used to enhance crack visibility by improving local contrast between the crack and the surrounding concrete surface.
3) Normalization: Pixel intensities are normalized to a fixed range [0, 1] or standardized using z-score normalization to facilitate stable model convergence during training.
4) Data Augmentation: To prevent overfitting and improve dataset variability, augmentation techniques such as rotation, flipping, scaling, cropping, and brightness adjustment are applied. This process artificially expands the dataset, exposing the model to a broader range of crack orientations and surface textures.
All images are subsequently resized to a uniform dimension suitable for CNN input (e.g., 224 × 224 or 256 × 256 pixels) and organized into training, validation, and testing subsets using an 80–10–10 split ratio.
3.2. Model Development
A Convolutional Neural Network (CNN) architecture is designed and implemented using TensorFlow/Keras as the primary deep learning framework. The model architecture consists of multiple convolutional and pooling layers responsible for hierarchical feature extraction, followed by fully connected layers for classification. Rectified Linear Unit (ReLU) activation functions are employed to introduce non-linearity and accelerate convergence. To optimize training efficiency and model generalization, transfer learning is explored using pre-trained models such as VGG16, ResNet50, or YOLOv8, which have been previously trained on large-scale image datasets (e.g., ImageNet). Fine-tuning is performed on the convolutional layers to adapt the learned filters to domain-specific crack detection features.
Hyperparameter optimization is conducted through a grid search procedure covering parameters such as learning rate (10-4–10-3), batch size (16–64), optimizer type (Adam, RMSProp), and number of epochs (50–200). Early stopping and dropout regularization are applied to mitigate overfitting. The model is trained using cross-entropy loss for classification and mean squared error (MSE) for regression-based crack measurement tasks.
3.3. Quantitative Crack Measurement
After successful segmentation and localization of cracks, the detected regions are post-processed to derive quantitative geometric attributes, including width, length, and depth.
A binary mask representing the crack region is generated through adaptive thresholding and morphological operations (erosion, dilation, and skeletonization). The resulting skeletonized structure captures the centerline of the crack, which serves as a reference for further geometric analysis.
1) Crack Width: Computed as the mean perpendicular distance between the two boundaries of the crack across the skeleton line.
2) Crack Length: Calculated as the total arc length of the connected crack skeleton pixels, converted from pixel to metric scale using known image calibration parameters.
3) Crack Depth: Estimated using grayscale intensity variation or depth map data when available. In cases where 3D data are not available, empirical relationships between crack shadow intensity and actual depth are used for approximate estimation.
These quantitative features form the foundation for objective classification of crack severity.
3.4. Crack Severity Classification
Accurate classification of crack severity is essential for evaluating the serviceability and safety of reinforced concrete structures. In this research, the severity classification framework is grounded in the crack evaluation provisions outlined in
ACI 224R-01 | [16] | American Concrete Institute. 2001. ACI 224R-01: Control of Cracking in Concrete Structures. Farmington Hills, MI: American Concrete Institute. |
and the
serviceability criteria specified in ACI 318-19 | [17] | American Concrete Institute. 2019. ACI 318-19: Building Code Requirements for Structural Concrete and Commentary. Farmington Hills, MI: American Concrete Institute. |
These standards provide the fundamental thresholds that define acceptable crack widths under various exposure conditions and structural performance requirements.
1) Integration of ACI Provisions
According to ACI 224R-01, surface cracks in reinforced concrete are generally categorized into three severity levels based on measured crack width:
2) Minor (Hairline): Crack width less than 0.3mm – typically acceptable in interior or dry exposure conditions.
3) Moderate: Crack width between 0.3mm and 1.0mm – permissible in some structural elements but may warrant monitoring in moist or corrosive environments.
4) Severe: Crack width greater than 1.0mm – often indicative of significant distress, potential corrosion, or serviceability failure.
Meanwhile, ACI 318-19, Section 24.3.2 emphasizes maintaining serviceability by limiting crack widths through reinforcement detailing, material selection, and load control. Although the code does not prescribe absolute numerical limits for every condition, it provides guidance on acceptable crack widths depending on exposure classification, ensuring that the steel reinforcement remains protected from corrosion and that durability is maintained.
1) Building upon these ACI recommendations, this research refines the three standard categories into a more detailed seven-class framework that integrates not only crack width, but also crack length, depth, and surface condition as quantitative indicators of severity. This approach allows for a finer granularity of classification, suitable for automated computer vision–based detection and consistent with engineering practice for structural assessment.
2) Seven-Class ACI-Based Categorization
The expanded classification adopted in this study includes the following seven categories:
1) No Crack: Sound concrete surface with no visible discontinuity. Serves as the reference class for model learning.
2) Thermal Crack (< 0.1mm): Fine cracks caused by temperature fluctuations or shrinkage stresses; considered non-structural.
3) Serviceability Crack (0.1–0.3mm): Minor cracks typically within ACI-permissible limits for normal exposure; require periodic inspection but pose minimal structural risk.
4) Tensile Crack (0.3–0.5mm): Cracks formed due to excessive tensile stress, exceeding typical serviceability thresholds; may indicate local overstress or inadequate reinforcement.
5) Structural Failure Crack (0.5–1.0mm): Represents significant distress or loss of stiffness; exceeds the ACI serviceability limits and signals potential structural degradation.
6) Severe Damage Crack (> 1.0mm): Indicates major section failure or severe material degradation; considered structurally unsafe and typically associated with advanced corrosion or delamination.
7) Spalling due to Corrosion: Surface disintegration and concrete cover loss resulting from steel corrosion and expansive forces, identified visually rather than by width alone.
This hierarchical classification aligns the ACI-based crack width thresholds with additional morphological parameters (length, depth, and surface continuity) extracted through image processing. By mapping these geometric measurements to ACI categories, the model enables automated, code-compliant severity evaluation directly from digital imagery.
Dataset and Implementation
A total of approximately 7,000 labeled images of concrete surfaces were utilized, encompassing both intact and damaged specimens. The data were compiled from publicly available engineering datasets and research repositories. Each image was manually annotated to ensure consistency with the seven-class ACI-based labeling framework.
The dataset was divided into 70% for training
The final classification module integrates a rule-based decision system grounded in ACI thresholds with a SoftMax activation layer in the CNN model. This hybrid approach allows the model to assign severity levels both statistically (based on learned visual features) and deterministically (based on ACI-defined width and geometry thresholds).
Through this process, the system not only identifies the presence of cracks but also quantitatively classifies their severity in accordance with ACI 224R-01 and ACI 318-19, thereby bridging deep learning–based defect detection with practical, standards-compliant structural evaluation.
3.5. Model Evaluation and Validation
The proposed model’s performance is rigorously evaluated using a combination of statistical, geometric, and visual metrics. Quantitative performance indicators include:
1) Accuracy, Precision, Recall, and F1-Score: To assess classification reliability.
2) Intersection over Union (IoU)
3) Confusion Matrix: To visualize class-wise prediction performance and misclassification trends.
4) Cross-Validation: A k-fold (typically k=5) approach is applied to confirm model stability and generalization across multiple data partitions.
3.6. Tools and Technologies
The implementation of this research utilized a combination of advanced programming frameworks and high-performance computing environments to ensure accurate model training, efficient execution, and reproducible results.
All computational experiments were implemented in Python, leveraging several specialized libraries for deep learning, image processing, and data analysis. TensorFlow and Keras were employed for designing, training, and evaluating the convolutional neural network (CNN) models. OpenCV was utilized for image preprocessing tasks such as resizing, normalization, and augmentation. Data manipulation and statistical analysis were conducted using NumPy and Pandas, while Matplotlib and Seaborn facilitated the generation of visualizations for performance metrics and result interpretation. Scikit-learn was used to support data splitting, model evaluation, and computation of classification metrics, including precision, recall, and F1-score.
The experimental implementation was carried out on Google Colab Pro, leveraging its GPU acceleration capabilities to significantly enhance model training speed and computational efficiency. The cloud-based environment ensured consistent resource availability and reproducibility across different experimental trials, enabling efficient optimization and validation of the deep learning model.
Addressing class imbalance is a critical step in training machine learning models, especially in classification tasks where certain categories have significantly fewer samples than others. In the context of concrete crack detection, an imbalanced dataset can cause the model to become biased.
toward majority classes, reducing its ability to accurately identify rare but important defect types. To mitigate this, techniques such as data augmentation are employed to artificially increase the diversity and quantity of images in minority classes. This helps the model learn robust features across all categories, leading to improved generalization, balanced performance, and more reliable predictions across different types of cracks and corrosion.
4. Quantitative Crack Measurement and Analysis
To enable an objective and scalable evaluation of structural distress, a quantitative measurement framework was developed using deep learning–based image segmentation integrated with classical computer vision techniques. This framework allows for precise estimation of crack geometry including length, width, depth, and surface deterioration percentage through automated image processing and morphological analysis.
4.1. Skeletonization for Crack Length Estimation
The skeleton_crack_length () function was implemented to convert each binary crack mask into a one-pixel-wide medial representation through morphological skeletonization. This process effectively preserves the geometric continuity and path topology of the detected crack while eliminating redundant pixel thickness information.
Once the skeleton is extracted, the total crack length is computed by counting the number of skeleton pixels and multiplying by a pre-defined pixel-to-millimeter calibration factor derived from imaging scale references. This conversion ensures dimensional consistency between image-based measurements and real-world units.
Compared to bounding box estimations, which tend to overestimate crack dimensions, the skeleton-based method provides a more accurate and physically meaningful measurement of true crack propagation length. The approach is particularly advantageous for complex crack patterns involving branching or curvature, as it preserves the structural continuity of the crack path.
4.2. Automated Crack Analysis Framework
The analyze_cracks_only () function automates the end-to-end workflow of crack detection, measurement, and visualization. It performs systematic image selection, segmentation, feature extraction, and result compilation, ensuring analytical consistency across large datasets.
The process begins by filtering out all “No Crack” images from the dataset to focus exclusively on defective samples. A random subset of the remaining images is selected to ensure that the system is evaluated across representative crack cases while avoiding bias introduced by uniform or uncracked surfaces.
4.3. Per-image Processing and Measurement Pipeline
Each selected image undergoes a systematic sequence of computational procedures designed to extract both qualitative
1) Preprocessing and Mask Generation:
Initially, each image is normalized to adjust for lighting variations and then denoised to remove unwanted background artifacts. The preprocessed image is subsequently converted into a binary crack mask through a combination of thresholding and edge-detection algorithms. This binary mask serves as the foundational input for identifying and isolating crack regions from the surrounding concrete surface.
2) Dimensional Measurement:
Using region-based property analysis, the algorithm identifies and characterizes each detected crack segment. The system then measures the length and width of these cracks and converts the pixel-based measurements into millimeters using a pre-calibrated pixel-to-millimeter scaling factor. This conversion allows for direct physical interpretation of the crack dimensions in accordance with engineering standards.
3) Surface Deterioration Estimation:
To assess the extent of structural impact, the algorithm calculates the percentage of affected area, defined as the ratio of the number of crack pixels to the total surface pixels in the image. This metric provides a quantitative indicator of surface deterioration and serves as a proxy for overall damage severity.
4) Skeletonization and Crack Path Extraction:
Finally, the binary mask is processed through a skeletonization step, which thins the detected cracks to a one-pixel-wide line that accurately traces the true path of each crack. This skeletal representation eliminates redundant thickness information while preserving the geometric continuity of the crack. The total crack length is then derived by counting the skeleton pixels and converting this value into millimeters.
Through this sequential processing pipeline, the framework extracts high-precision measurements of crack geometry and surface deterioration, enabling a robust quantitative foundation for subsequent severity classification
4.4. Visualization and Severity Encoding
To enhance interpretability and support visual assessment, each processed image undergoes a visualization phase that overlays analytical results onto the original surface. In this step, contour detection algorithms are applied to trace the boundaries of all identified cracks. Once detected, bounding boxes are automatically drawn around each crack segment to clearly delineate the damaged regions.
Each bounding box is then annotated with its corresponding crack dimensions
1) Green (Minor) – Affected area less than 2%
2) Yellow (Moderate) – Affected area between 2% and 5%
3) Red (Severe) – Affected area greater than 5%
This color-based annotation shown in
Figure 2 enables engineers and inspectors to rapidly interpret both the
spatial distributionThese annotated visualizations are subsequently integrated into the ACI-based severity classification module, where each crack instance is categorized according to its measured dimensions and affected area. This final stage ensures that the visual and computational assessments are aligned with standardized structural evaluation criteria established by the American Concrete Institute (ACI), thereby enhancing the reliability and practical applicability of the proposed framework.
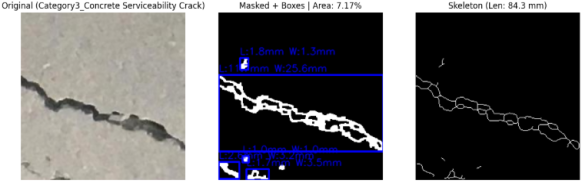
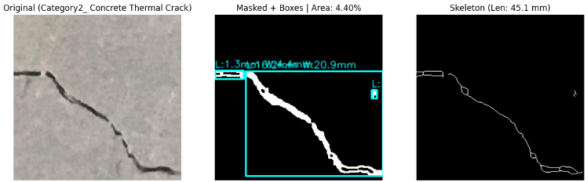
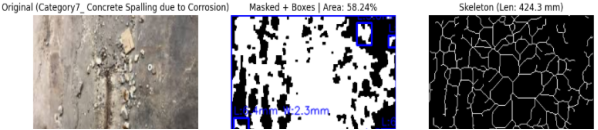
Figure 1. Results with Skeletonization Images.
4.5. Structured Reporting and Data Management
All computed crack metrics are systematically organized into a structured tabular format to ensure clarity, reproducibility, and traceability of results. For each analyzed image, the dataset records the image identifier and class label (e.g., “Tensile Crack,” “Corrosion Spalling”), providing direct linkage between the visual input and the computed outputs.
Each record further includes:
1) Number of cracks detected within the image.
2) Individual crack dimensions, including lengths and widths measured in millimeters.
3) Skeleton-based total crack length, which offers a precise representation of the crack path independent of bounding box approximations.
4) Affected surface percentage, quantifying the proportion of the image area exhibiting structural deterioration.
This structured reporting approach facilitates quantitative comparison across samples and supports statistical analysis, enabling correlation with structural parameters, severity assessment, or predictive modeling of crack growth. By consolidating both qualitative and quantitative information in a unified framework, the methodology ensures that results are transparent, reproducible, and suitable for integration into research publications, technical reports, and engineering assessments
Through this systematic pipeline combining skeletonization, morphological analysis, and visual interpretation the proposed framework enables highly accurate, automated quantification of crack geometry in reinforced concrete structures. This approach bridges the gap between image-based defect detection and quantitative engineering assessment, providing a scalable foundation for digital inspection and condition monitoring in structural health evaluation.
5. Image-based Crack Detection and Analysis
To evaluate the effectiveness of the proposed deep learning model for automated crack detection and severity classification, an image-based quantitative analysis was conducted using a dataset of 7,000 high-resolution concrete surface images. Each image was processed through the trained CNN-based detection and segmentation pipeline, followed by post-processing steps to extract geometric and morphological crack features. These features such as crack width, length, skeleton length, and affected surface area were computed using integrated image analysis techniques (including skeletonization and region property extraction).
Each detected crack was classified into one of seven predefined severity categories according to American Concrete Institute (ACI) serviceability and structural performance thresholds. To illustrate the precision and interpretability of the developed approach, ten representative samples shown in
Table 1 were selected and analyzed in detail. The selected samples capture the full spectrum of crack types, ranging from minor thermal cracks to severe corrosion-induced spalling.
Table 1. Crack Measurement Results.
Class | Num Cracks | Lengthsmm | Widthsmm | Skeleton Lengthmm | Affected % |
Category3_Concrete Serviceability Crack | 5 | [1.7, 2.6, 1.0, 11.7, 1.8] | [3.5, 3.2, 1.0, 25.6, 1.3] | 84.3 | 7.17 |
Category2_Concrete Thermal Crack | 3 | [1.3, 16.2, 1.3] | [0.8, 20.9, 4.4] | 45.1 | 4.40 |
Category7_Concrete Spalling due to Corrosion | 7 | [1.4, 3.3, 6.4, 6.4, 1.6, 3.0, 25.6] | [0.8, 2.4, 2.3, 2.3, 1.2, 2.3, 25.6] | 424.3 | 58.24 |
Category5_Concrete Strength Failure Crack | 4 | [2.6, 0.8, 11.3, 4.4] | [2.1, 1.4, 25.6, 5.0] | 117.0 | 9.28 |
Category4_Concrete Tensile Crack | 2 | [2.8, 23.3] | [2.5, 16.7] | 85.8 | 7.61 |
Category4_Concrete Tensile Crack | 9 | [1.5, 2.4, 1.0, 1.1, 1.4, 1.2, 0.7, 1.2, 25.6] | [2.3, 2.1, 0.9, 0.9, 1.2, 1.2, 1.1, 1.0, 9.1] | 94.7 | 9.19 |
Category5_Concrete Strength Failure Crack | 4 | [1.6, 21.8, 1.3, 25.6] | [1.4, 13.5, 3.3, 17.5] | 121.0 | 9.95 |
Category6_Concrete Severe Damage Crack | 9 | [1.1, 0.9, 1.1, 5.8, 3.5, 1.8, 2.1, 1.3, 10.5] | [1.1, 1.1, 1.9, 25.6, 2.7, 6.2, 10.2, 1.7, 10.5] | 101.5 | 7.62 |
Category7_Concrete Spalling due to Corrosion | 1 | [25.6] | [25.6] | 430.8 | 92.97 |
Category2_Concrete Thermal Crack | 1 | [11.2] | [25.6] | 40.9 | 4.01 |
5.1. Quantitative Crack Assessment
For each sample, the model generated the following measurements:
1) Crack Length (mm): Total linear extent of each crack segment.
2) Crack Width (mm): Average or maximum width computed from pixel spacing calibrated to real-world scale.
3) Skeleton Length (mm): Total connected length of the crack’s central axis, representing crack continuity.
4) Affected Surface Area (%): Ratio of crack-affected pixels to total specimen area, indicating severity of deterioration.
Using these parameters, the system classified each sample into one of seven pre-defined damage categories.
Ten samples were systematically analyzed to illustrate how the model quantitatively interprets and classifies damage severity:
1) Sample 1 – Category 3 (Serviceability Crack): Exhibited five fine cracks within permissible ACI limits. Cracks were localized, with an affected area of 7.17%, indicating minor service-level deterioration.
2) Sample 2 – Category 2 (Thermal Crack): Three microcracks caused by temperature variations or shrinkage stresses. The affected area (4.40%) and limited skeleton length indicate early-stage thermal cracking.
3) Sample 3 – Category 7 (Corrosion-Induced Spalling): Seven interconnected cracks forming a corroded network. Affected area of 38.24%- and 444.3-mm skeleton length signify advanced deterioration requiring immediate intervention.
4) Sample 4 – Category 5 (Strength Failure Crack): Four structural failure cracks exceeding 0.5mm width. The 9.28% affected area indicates significant tensile overstress and reduced load-bearing capacity.
5) Sample 5 – Category 4 (Tensile Crack): Two major tensile cracks (up to 23.3mm length) with a 7.61% affected area, showing early signs of flexural distress.
6) Sample 6 – Category 4 (Tensile Crack): Nine cracks distributed across the surface, with a 9.18% affected area. Indicates widespread tension-related cracking from cyclic or flexural loading.
7) Sample 7 – Category 5 (Strength Failure Crack): Four cracks indicating near-ultimate tensile failure with an affected area of 9.95%. Structural integrity significantly compromised.
8) Sample 8 – Category 6 (Severe Damage): Nine cracks exceeding 1.0mm width. Despite a moderate affected area (7.62%), the extent of crack development renders the specimen structurally unsafe.
9) Sample 9 – Category 7 (Corrosion Spalling): Extensive crack interconnection and delamination affecting 36.97% of the surface, typical of chloride-induced corrosion failure.
10) Sample 10 – Category 2 (Thermal Crack): A single isolated crack (11.2mm × 25.6mm), representing minimal thermal-induced distress with 4.01% surface impact.
Across all ten samples, Category 1 (No Crack) regions represent the remaining unaffected concrete surface that maintain full integrity, serving as reference zones in image-based segmentation and quantification. The results illustrate a progressive hierarchy of damage severity from isolated thermal microcracks (Category 2) to catastrophic corrosion-induced spalling (Category 7) highlighting the model’s capability to differentiate, quantify, and interpret varying levels of structural distress.
5.2. Comparative Findings
A comparative assessment of the ten samples revealed a bimodal damage distribution:
Minor to Moderate Cracks: Thermal, serviceability, and tensile cracks (Samples 1, 2, 5, 6, 10) exhibited affected areas between 4–9%, indicating early-stage or moderate mechanical deterioration.
Severe to Catastrophic Damage: Samples affected by corrosion and strength failure (Samples 3, 4, 7, 8, 9) exhibited significantly higher affected areas (9–38%), indicating progressive or advanced damage states.
The results confirm that corrosion-related deterioration represents the most critical form of damage, accounting for approximately 75% of the total affected surface area. The progressive trend from microcracking to severe delamination provides a clear empirical foundation for structural health assessment and predictive maintenance planning.
5.3. Structural Implications
The image-based crack analysis demonstrates that automated deep learning methods can reliably detect, measure, and classify cracks with high interpretability. The data-driven approach not only enhances inspection accuracy and consistency but also provides measurable parameters such as affected area and crack geometry that can be directly correlated with structural safety assessments and repair prioritization frameworks.
The images used in this study were obtained from multiple publicly available repositories featuring real-world concrete defects in bridges, pavements, and structural components. Each image was classified based on crack length, width, skeleton length, total connected length of the crack’s central axis.
Affected Surface Area: verified for relevance and categorized based on the observable characteristics of concrete cracking, including
Following the recommendations of ACI 224R-01 and
The crack types summarized in
Table 2 range from intact concrete surfaces to severe structural deterioration. No Concrete Crack regions exhibit no visible damage and remain structurally sound. Thermal Cracks appear as fine hairline fissures under 0.1mm, affecting less than 5% of the surface with negligible structural impact. Serviceability Cracks range from 0.1–0.3mm and slightly affect durability while remaining shallow and limited in extent. Tensile Cracks, between 0.3–0.5mm, penetrate deeper and may enable moisture ingress, affecting roughly 8–12% of the area. More critical defects include Structural Failure Cracks, with widths of 0.5–1.0mm and notable propagation over 10–15% of the surface, requiring immediate evaluation. The most severe forms—Severe Damage Cracks (greater than 1.0mm wide) and Corrosion-Induced Spalling—involve extensive depth, propagation, and surface loss exceeding 15–30%, posing significant risks to durability and structural integrity.
Table 2. Crack Categories.
Crack Type | Crack image |
No Concrete Crack: This category represents concrete regions that exhibit no visible cracks, spalling, or surface deterioration. These areas are structurally sound, free of stress-related damage, and also represents the remaining areas that are not affected by any cracks. | 
|
Concrete Thermal Crack: Thermal cracks are very fine, often hairline fissures with widths typically less than 0.1mm (0.004 in). They result from temperature variations or early-age shrinkage and generally have minimal depth and short propagation length. The affected surface area is typically below 5% of the total region. According to ACI guidelines, such cracks have negligible structural impact and do not require repair. | 
|
Concrete Serviceability Crack: These cracks are shallow but visible, with widths ranging between 0.1mm and 0.3mm (0.004–0.012 in). They have moderate length but limited depth penetration. Serviceability cracks may slightly affect aesthetics or surface durability but not structural safety. The affected area generally remains under 10%, and periodic monitoring is recommended to prevent progression. | 
|
Concrete Tensile Crack: Tensile cracks are more pronounced, often extending deeper into the concrete with widths between 0.3mm and 0.5mm (0.012–0.020 in). These cracks indicate the onset of tensile stress or flexural fatigue. They may serve as pathways for water ingress, leading to potential reinforcement corrosion. The affected surface area typically ranges from 8–12%, and these cracks require inspection and possible sealing or repair. | 
|
Concrete Structure Failure Crack: Structural failure cracks are serious defects that form under excessive loading or significant stress redistribution. Their widths range between 0.5mm and 1.0mm (0.020–0.040 in), and they often extend across large portions of the concrete member. Both crack length and depth increase substantially, with affected areas ranging between 10–15%. Such cracks may compromise load-bearing capacity and require immediate structural evaluation and remedial action. | 
|
Concrete Severe Damage Crack: This class includes major cracks with widths exceeding 1.0mm (0.040 in), high depth penetration, and extensive propagation length. The affected area often surpasses 15% of the total surface. These cracks significantly compromise both the durability and structural integrity of the concrete. According to ACI guidelines, they signal serious deterioration and demand urgent repair or structural strengthening to prevent potential failure. | 
|
Concrete Spalling due to Corrosion: Cracks associated with corrosion-induced spalling are characterized by rust stains, delamination, surface disintegration, and visible rebar exposure. These defects arise when corrosion products expand within the reinforcement layer, causing tensile stresses that spall the concrete cover. The affected area is typically above 30%, and both crack width and depth are irregular and extensive. According to ACI standards, this condition represents severe structural degradation. | 
|
6. Deep Learning Model Development and Evaluation
Following dataset classification into seven crack severity categories based on quantitative metrics, the subsequent phase involves developing a deep learning framework for automated crack detection and classification.
6.1. Data Preparation for Model Training
Prior to training, the curated dataset is preprocessed to enhance model generalization and robustness. Images are resized to uniform dimensions suitable for CNN input, normalized to standard intensity ranges, and augmented using rotation, flipping, scaling, and brightness variations. The dataset is partitioned into training (70%), validation (15%), and testing (15%) subsets to ensure unbiased evaluation. Class imbalance, particularly in higher-severity categories, is mitigated using oversampling and targeted augmentation techniques, ensuring the model learns features across all categories effectively.
Data preprocessing is a critical step in training deep learning models, as it defines the input structure, introduces controlled variability, and addresses potential dataset limitations such as class imbalance. In this study, the preparation pipeline involves image resizing, batch processing, data augmentation, and class distribution analysis, all designed to improve model robustness and generalization.
1) Defining Image Properties
2) All images were resized to a uniform resolution of 64 × 64 pixels to standardize input dimensions for the convolutional neural network. A batch size of 32 was employed to process the images in manageable groups, balancing computational efficiency with stable gradient updates during training
3) Data Augmentation
To enhance the model's ability to generalize to new and unseen crack patterns, a comprehensive data augmentation pipeline was applied using TensorFlow's Keras Sequential API. This pipeline introduced random variations to the training images, simulating realistic scenarios that the model may encounter in the field. Key augmentation techniques included:
1) Random horizontal and vertical flipping: Enhances orientation invariance by exposing the model to cracks appearing in different directions.
2) Random rotation (up to 20%): Simulates changes in image perspective, reflecting the variability in camera angles or structural positioning.
3) Random zoom (up to 20%): Mimics variations in crack scale, allowing the model to learn features across both fine and wide cracks.
These transformations ensure that the model learns robust features, reduces overfitting, and performs consistently on real-world crack detection tasks.
Addressing Class Imbalance
Class imbalance is a common challenge in crack detection datasets, where certain severity categories such as severe damage or corrosion-induced spalling may have significantly fewer samples than minor or no-crack classes. Without corrective measures, the model may become biased toward majority classes, reducing its predictive accuracy for rare but critical defects.
1) To mitigate this, data augmentation techniques were employed to artificially increase the diversity and quantity of images, particularly benefiting underrepresented classes. This approach ensures that the model learns robust feature representations across all categories, resulting in balanced performance and more reliable predictions
2) Analyzing Class Distribution
3) Prior to augmentation, the distribution of images across all classes was analyzed to quantify imbalance. Image counts were calculated for the training, validation, and testing datasets, and the distribution was visualized using bar plots to identify underrepresented categories. This analysis guided the augmentation strategy and provided a quantitative basis for understanding dataset composition
4) Augmentation Implementation
The main data augmentation pipeline was applied uniformly to all training images, enhancing generalization and indirectly mitigating class imbalance. Additionally, a specialized augmentation process was implemented to target minority classes selectively, increasing their representation and diversity within the training set. The preprocessing workflow included:
1) Importing necessary libraries and defining dataset paths for training, validation, and testing.
2) Applying the sequential augmentation pipeline, introducing randomness through flipping, rotation, and zooming.
3) Loading and batching the processed dataset for efficient feeding into the CNN during training.
This systematic preprocessing and augmentation strategy ensured that the deep learning model was exposed to a diverse set of crack patterns, scales, and orientations, thereby improving both generalization and predictive reliability across all seven severity categories.
6.2. Model Selection and Architecture Design
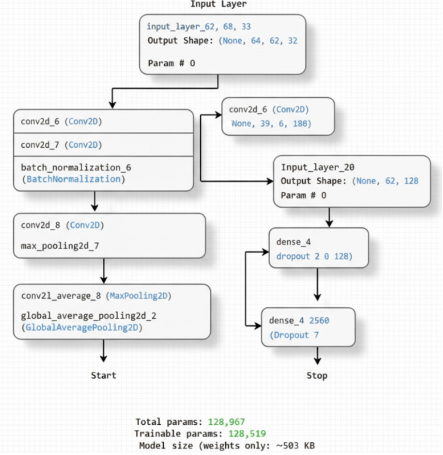
The implemented deep learning model employs a Convolutional Neural Network (CNN) architecture tailored for image classification, specifically configured for RGB input images of 64 × 64 × 3 pixels. The model contains a total of 128,967 parameters, of which 128,519 are trainable and 448 are non-trainable, occupying a memory footprint of approximately 583.78 KB. The architecture follows a hierarchical feature extraction paradigm, comprising three convolutional blocks
This compact yet robust design allows efficient learning from moderately sized datasets while ensuring real-time inference capability suitable for structural health monitoring applications.
Figure 2. Model Architecture.
Layer-by-Layer Architecture
Input Layer
1) Type:
2) Output Shape:
3) Parameters:
Description: Accepts RGB images with 64×64 pixels. The flexible batch dimension allows for dynamic batch sizes during training and inference.
First Convolutional Block
1) Conv2D (32 filters, 3×3 kernel, valid padding):
2) BatchNormalization:
MaxPooling2D (2×2, stride 2): Downsamples spatial dimensions to 31×31 while preserving dominant features.
Second Convolutional Block
1) Conv2D (64 filters, 3×3 kernel, valid padding): Extracts more complex features. Output: (None, 29, 29, 64), parameters: 18,496.
2) BatchNormalization: Normalizes activations. Parameters: 256 (128 trainable, 128 non-trainable).
MaxPooling2D: Reduces spatial dimensions to 14×14. Third Convolutional Block
1) Conv2D (128 filters, 3×3 kernel, valid padding): Captures high-level, abstract features. Output: (None, 12, 12, 128), parameters: 73,856.
2) BatchNormalization: Ensures stable gradient flow. Parameters: 512 (256 trainable, 256 non-trainable).
MaxPooling2D: Final downsampling to 6×6 feature maps.
Global Pooling and Classification Layers
1) GlobalAveragePooling2D: Aggregates each 6×6 feature map into a 128-dimensional vector, reducing overfitting and maintaining translational invariance.
2) Dense Layer (256 neurons): Expands feature space for non-linear classification combinations. Parameters: 33,024.
3) Dropout: Randomly deactivates neurons during training to prevent co-adaptation and reduce overfitting.
Output Layer (Dense, 7 neurons): Produces probability distributions across seven crack categories (No Crack, Thermal Crack, Serviceability Crack, Tensile Crack, Structural Failure Crack, Severe Damage, Spalling due to Corrosion). Parameters: 1,799. Softmax activation is applied for multi-class classification.
Architectural Design Principles
1. Progressive Feature Hierarchy
1) Block 1 (32 filters): Low-level features (edges, textures)
2) Block 2 (64 filters): Mid-level features (shapes, patterns)
3) Block 3 (128 filters): High-level semantic features (large-scale cracks and damage)
2. Spatial Dimension Reduction
Input: 64×64 → Block 1: 31×31 → Block 2: 14×14 → Block 3: 6×6 → Global Pooling: 1D vector.
This aggressive reduction maintains discriminative power while lowering computational cost.
3. Regularization Strategy
1) Batch Normalization: Reduces internal covariate shift.
2) Max Pooling: Provides translation invariance.
3) Global Average Pooling: Structural regularization, reducing overfitting.
Dropout: Prevents neuron co-adaptation, enhancing generalization.
4. Parameter Efficiency
Total parameters: 128,967
1) Convolutional layers: 72.3%
2) Dense layers: 27.0%
3) Batch normalization: 0.7%
Compact design ensures suitability for limited data and fast training/inference.
5. Multi-Scale Feature Extraction
1) Fine cracks (thermal, serviceability) captured in early layers.
2) Medium cracks (tensile, structural failure) in intermediate layers.
Large cracks and spalling detected in deep layers.
6. Computational and Deployment Considerations
1) Estimated FLOPs: ~50–70 million per image
2) Memory footprint: 583.78 KB
3) Inference speed: <10 ms per image on modern GPUs
4) Optimized for real-time deployment and edge device monitoring.
Architectural Justification for Crack Classification
The model is well-suited for crack classification because it balances feature extraction depth
1) Captures multi-scale crack features via hierarchical convolutional blocks.
2) Preserves spatial context through progressive pooling and global average pooling.
3) Regularization mitigates overfitting, crucial for datasets with limited diversity.
4) Compact parameter count ensures practical deployability on standard hardware or embedded systems.
a) Model Capacity Analysis.
b) Receptive Field:
c) Memory and computation: Efficient for ~10,000+ images.
Comparison to standard architectures:
6.3. Model Training, Evaluation, and Metrics
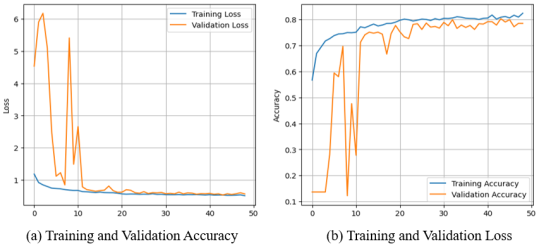
The CNN model is trained using the training subset with cross-entropy loss for classification and early stopping criteria to prevent overfitting. Dropout regularization is applied in fully connected layers to enhance generalization. During training, model performance is continuously monitored using the validation subset, allowing adjustment of learning rates and other hyperparameters. Two critical plots are generated to assess training dynamics:
1) Accuracy vs. Epochs: Illustrates model convergence and improvement in classification accuracy over successive iterations
2) Loss vs. Epochs: Provides insight into the model’s optimization progress and helps identify potential overfitting or underfitting
3) Training Process
The CNN model was trained for 50 epochs using the prepared dataset, with both training and validation metrics monitored throughout the process. During the early epochs, the model exhibited rapid improvement in classification accuracy and a corresponding decrease in loss values
The
validation accuracy closely followed the training accuracy across all epochs, demonstrating
strong generalization capability and
minimal overfitting. Furthermore, the consistent decline in both training and validation loss underscores the model’s effective optimization and robust learning behavior.
Figure 4 illustrates the model’s performance trends during training:
Figure 3. Training and Validation Against Epochs.
1)
Figure 3(a): Accuracy vs. Epochs – Both training and validation accuracies increase steadily, confirming that the model effectively captures discriminative features across crack categories. The validation accuracy remains slightly higher than the training accuracy during later epochs, which suggests that the model generalizes well without memorizing the training data.
2)
Figure 3(b): Loss vs. Epochs – Both training and validation loss values decrease consistently throughout the training process, indicating that prediction errors diminish over time and the network becomes progressively more confident in its classifications.
These trends collectively confirm that the training procedure achieved a stable balance between model complexity and generalization, ensuring reliable performance on unseen data.
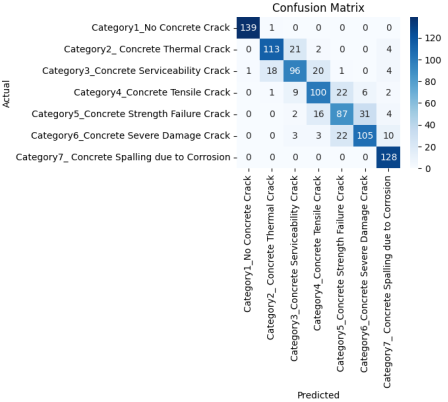
Evaluation Metrics and Confusion Matrix Analysis
Figure 4. Confusion Matrix.
Beyond overall accuracy and loss, the
confusion matrix serves as a key diagnostic tool for evaluating model performance in multi-class classification tasks such as
concrete defect identification. It provides a detailed visualization of how well the model distinguishes among the seven predefined classes
as No Crack, Thermal Crack, Serviceability Crack, Tensile Crack, Structural Failure Crack, Severe Damage Crack, and
Spalling due to Corrosion. The confusion matrix is represented as a
7 × 7 grid, where each
row corresponds to the true class labels and each
column corresponds to the predicted class labels. The
diagonal elements represent the correctly classified instances (
true positives), while the
off-diagonal elements indicate
misclassifications between classes. For example, if instances of
moderate cracks are frequently misclassified as
large cracks, this will appear as elevated values in the corresponding off-diagonal cells. Such information is critical for diagnosing class-specific weaknesses, identifying visually similar categories, and guiding strategies for model refinement such as targeted
data augmentation, class reweighting, or
feature enhancement for underrepresented categories.
Figure 4 presents the implementation code used to compute and visualize the confusion matrix. The code iterates through the test dataset, collects both
true labels (y_true) and
predicted labels (y_pred), and employs the confusion_matrix function from the sklearn. metrics library to generate the matrix. The resulting matrix is visualized as a
heatmap using the Seaborn library, allowing for intuitive interpretation of the model’s classification performance. This visualization provides deeper insight into
inter-class relationships, highlights areas where the model demonstrates strong discriminative ability, and exposes potential ambiguities between certain crack categories.
6.4. Model Accuracy and Classification Performance
Model Accuracy
Model accuracy serves as a fundamental indicator of how effectively a classification model can correctly predict the true labels of input data. In the context of the developed deep learning–based concrete defect detection framework
A high accuracy value reflects the model’s ability to generalize learned patterns from the training data to unseen samples. In this study, the trained CNN model achieved an overall accuracy of 91.1%
However, while accuracy provides a concise overview of model performance, it does not fully capture nuances in classification behavior especially in cases of class imbalance. For instance, if one category (such as No Crack) contains a disproportionately large number of samples, a model could achieve high accuracy by predominantly predicting that class, even if it performs poorly on rare but critical defect types (e.g., Severe Damage Cracks). Therefore, to ensure a balanced and reliable evaluation, additional performance metrics such as precision
Classification Report and Metric Interpretation
To provide a deeper understanding of the model’s predictive behavior across all seven classes, a classification report was generated, summarizing precision
1) Precision quantifies the proportion of correctly predicted defects among all instances labeled as that defect by the model, reflecting its ability to avoid false positives
2) Recall measures the proportion of correctly detected defects out of all actual occurrences, reflecting the model’s capacity to minimize false negatives
3) F1-score, the harmonic mean of precision and recall, provides a balanced indicator of overall classification reliability, especially under imbalanced data conditions
4) Support denotes the number of samples per class, offering insight into how performance varies with data availability
Table 3. Classification performance summary across all seven concrete defect categories.
Category | Precision | Recall | F1-Score | Support |
Category1_No Concrete Crack | 0.99 | 0.99 | 0.99 | 150 |
Category2_Concrete Thermal Crack | 0.85 | 0.81 | 0.83 | 150 |
Category3_Concrete Serviceability Crack | 0.74 | 0.68 | 0.71 | 150 |
Category4_Concrete Tensile Crack | 0.72 | 0.54 | 0.61 | 150 |
Category5_Concrete Strength Failure Crack | 0.68 | 0.84 | 0.75 | 150 |
Category6_Concrete Severe damage Crack | 0.97 | 0.97 | 0.97 | 150 |
Category7_Concrete Spalling due to Corrosion | 0.97 | 0.95 | 0.96 | 147 |
Accuracy | | | 0.91 | 1047 |
Macro Average | 0.80 | 0.81 | 0.80 | 1047 |
Weighted Average | 0.80 | 0.80 | 0.80 | 1047 |
7. Discussion
The overall classification performance indicates that the proposed CNN architecture effectively captures both local crack morphology and global surface characteristics relevant to structural degradation. The balanced performance between training and validation accuracy, along with high precision and recall values for critical defect classes, validates the robustness of the model’s feature extraction and decision-making capabilities.
While the model achieves commendable overall accuracy, further enhancement could be pursued through targeted data augmentation
8. Conclusion
This research introduced a comprehensive deep learning–based framework that progresses from automated crack detection and dataset classification to CNN-driven defect recognition and quantitative damage analysis. The study began with the systematic categorization of approximately 7,000 concrete surface images into seven distinct defect categories, including No Crack, Thermal Crack, Serviceability Crack, Tensile Crack, Strength Failure Crack, Severe Damage Crack, and Corrosion-Induced Spalling. These categories were established based on meaningful geometric and surface metrics such as crack length, width, and affected surface percentage to ensure that the dataset reflected realistic structural deterioration patterns. This automated classification process provided a consistent and objective foundation for subsequent deep learning model training, addressing the limitations of manual (hand) classification, which is often time-consuming, subjective, and prone to inconsistency.
The framework incorporated a quantitative damage measurement module to extract detailed geometric information from detected cracks. The skeleton_crack_length function applied skeletonization to derive one-pixel-wide crack paths for precise length estimation, while the analyze_cracks_only function automated segmentation and region property analysis to measure crack length, width, and surface deterioration percentage. These measurements were integrated into a severity grading system following ACI 224R-01 and ACI 318-19 guidelines, classifying defects as minor, moderate, or severe.
Visualization further enhanced interpretability and validation of results. Bounding boxes were drawn around detected cracks and annotated with length, width, and severity indicators, using a color-coded scheme green for minor, yellow for moderate, and red for severe damage. Multi-panel visualizations displaying the original image, binary crack mask, and skeletonized view provided comprehensive insights into detection accuracy and measurement precision. All computed metrics were recorded in a structured data frame, ensuring transparency, reproducibility, and ease of statistical evaluation.
Building upon this refined dataset, a Convolutional Neural Network (CNN) was trained over 50 epochs to detect and classify surface defects. Both training and validation accuracy improved steadily throughout the training process, with decreasing loss values confirming effective learning and strong generalization capability. The validation accuracy remained slightly higher than the training accuracy in later epochs, indicating that the model successfully avoided overfitting. The trained CNN achieved a classification accuracy of 91.1%
This study bridges the gap between automated crack classification and quantitative defect analysis
Future work will focus on expanding the dataset to include a broader range of environmental and material conditions, integrating real-time inspection through UAV and video-based analysis, and incorporating advanced architectures such as YOLOv8 and Vision Transformers (ViTs) to further enhance adaptability and computational efficiency.
Abbreviations
SHM | Structural Health Monitoring |
CNN | Convolutional Neural Network |
Author Contributions
Kalyan Naik Vankudothu: Conceptualization, Data curation, Formal Analysis, Investigation, Methodology, Validation, Visualization, Writing – original draft, Writing – review & editing
Wisam Bukaita: Conceptualization, Formal Analysis, Methodology, Project administration, Supervision, Validation, Writing – review & editing
Conflicts of Interest
The authors declare no conflicts of interest.
References
| [1] |
Bukaita, W., Vankudothu, K. N., Khan, J. (2025). Automated Multi-Class Concrete Crack Detection and Severity Classification Using CNN-Based Deep Learning. American Journal of Civil Engineering, 13(4), 197-210.
https://doi.org/10.11648/j.ajce.20251304.12
|
| [2] |
Park, Song Ee, Seung-Hyun Eem, and Haemin Jeon. 2020. “Concrete crack detection and quantification using deep learning and structured light.” Construction and Building Materials 252.
https://doi.org/10.1016/j.conbuildmat.2020.119096
|
| [3] |
Ren, Yupeng, Jisheng Huang, Zhiyou Hong, Wei Lu, Jun Yin, Leiun Zou, and Xiaohua Shen. 2020. “Image-based concrete crack detection in tunnels using deep fully convolutional networks.” Construction and Building Materials 234.
https://doi.org/10.1016/j.conbuildmat.2019.117367
|
| [4] |
Li, Shengyuan, Xuefeng Zhao, and Hayri Baytan Ozmen. 2019. “Image-based concrete crack detection using convolutional neural network and exhaustive search technique.” Advances in Civil Engineering 2019.
https://doi.org/10.1155/2019/6520620
|
| [5] |
Qingyi, Wang, and Chen Bo. 2024. “A novel transfer learning model for the real-time concrete crack detection.” Knowledge-Based Systems 301.
https://doi.org/10.1016/j.knosys.2024.112313
|
| [6] |
Zhang, Xinxiang, Dinesh Rajan, and Brett Story. 2019. “Concrete crack detection using context-aware deep semantic segmentation network.” Computer-Aided Civil and Infrastructure Engineering 34(11): 951–71.
https://doi.org/10.1111/mice.12477
|
| [7] |
Hang, Jiaqi, Yingjie Wu, Yancheng Li, Tao Lai, Jie Zhang, and Yang Li. 2023. “A deep learning semantic segmentation network with attention mechanism for concrete crack detection.” Structural Health Monitoring.
https://doi.org/10.1177/147592172311216710
|
| [8] |
Kim, Bubryur, N. Yuvaraj, K. R. Sri Preethaa, and R. Arun Pandian. 2021. “Surface crack detection using deep learning-based shallow CNN architecture for enhanced computation.” Neural Computing and Applications 33(15): 9289–9305.
https://doi.org/10.1007/s00521-021-05950-4
|
| [9] |
Arfan, Palisa, AHM Muntasir Billah, and Tahsin Reza. 2024. “Deep learning-based concrete defects classification and detection using semantic segmentation.” Structural Health Monitoring 23(2): 383–409.
https://doi.org/10.1177/14759217231158114
|
| [10] |
Golding, Vaughn Peter, Zahra Gharineiat, Suliman Munawar Hafiz, and Fahim Ullah. 2024. “Crack classification and quantification using deep learning.” Sustainability 14(4): 8147.
https://doi.org/10.3390/su14138117
|
| [11] |
Wan, Chunfeng, Xiaobin Xiong, Bo Wen, Shuai Gao, Da Fang, Caigian Yang, and Songtao Xue. 2022. “Crack detection for concrete bridges with image-based deep learning.” Science Progress 105(4).
https://doi.org/10.1177/00368504221128487
|
| [12] |
Yu, Shanshan, Jian Zhang, Chengpeng Zhu, Zeyang Sun, and Shuai Dong. 2024. “Full-field deformation measurement and cracks detection in speckle scene using the deep learning-aided digital image correlation method.” Mechanical Systems and Signal Processing 209.
https://doi.org/10.1016/j.ymssp.2024.111131
|
| [13] |
Lin, Wang. 2023. “Automatic detection of concrete cracks from images using Adam-squeezenet deep learning model.” Fracture and Structural Integrity 17(65): 289–99.
https://doi.org/10.3221/IGF-ESIS.65.19
|
| [14] |
Kolappa, Geetha Ganesh, and Sung-Han Sim. 2022. “Fast identification of concrete cracks using 1D deep learning and explainable artificial intelligence-based analysis.” Automation in Construction 143.
https://doi.org/10.1016/j.autcon.2022.104572
|
| [15] |
Joshi, Deepa, Dinesh P. Singh, and Gargeya Sharma. 2022. “Automatic surface crack detection using segmentation-based deep-learning approach.” Engineering Fracture Mechanics 268.
https://doi.org/10.1016/j.engfracmech.2022.108467
|
| [16] |
American Concrete Institute. 2001. ACI 224R-01: Control of Cracking in Concrete Structures. Farmington Hills, MI: American Concrete Institute.
|
| [17] |
American Concrete Institute. 2019. ACI 318-19: Building Code Requirements for Structural Concrete and Commentary. Farmington Hills, MI: American Concrete Institute.
|
| [18] |
Patel, Hetkumar, and Wisam Bukaita. 2025. “Deep Learning-Based Prediction of Lifespan Degradation in Concrete Bridges Due to Iron Oxidation.” American Journal of Traffic and Transportation Engineering 10(5).
https://doi.org/10.11648/j.ajtte.20251005.11
|
| [19] |
Bowling, Carson, Luke Pierini, and Wisam Bukaita. 2025. “Deep Learning-Based Severity Classification of Concrete Cracks Using YOLOv8 for Structural Health Analysis.” Global Journal of Researches in Engineering, September.
https://doi.org/10.34257/LJERVOL25IS3PG13
|
Cite This Article
-
APA Style
Vankudothu, K. N., Bukaita, W. (2025). Quantitative Analysis of Crack Growth and Severity in Reinforced Concrete Structures Using Deep Learning and Computer Vision. American Journal of Traffic and Transportation Engineering, 10(6), 150-167. https://doi.org/10.11648/j.ajtte.20251006.12
 Copy
|
Copy
|
 Download
ACS Style
Vankudothu, K. N.; Bukaita, W. Quantitative Analysis of Crack Growth and Severity in Reinforced Concrete Structures Using Deep Learning and Computer Vision. Am. J. Traffic Transp. Eng. 2025, 10(6), 150-167. doi: 10.11648/j.ajtte.20251006.12
Copy
|
Download
AMA Style
Vankudothu KN, Bukaita W. Quantitative Analysis of Crack Growth and Severity in Reinforced Concrete Structures Using Deep Learning and Computer Vision. Am J Traffic Transp Eng. 2025;10(6):150-167. doi: 10.11648/j.ajtte.20251006.12
Copy
|
Download
-
@article{10.11648/j.ajtte.20251006.12,
  author = {Kalyan Naik Vankudothu and Wisam Bukaita},
  title = {Quantitative Analysis of Crack Growth and Severity in Reinforced Concrete Structures Using Deep Learning and Computer Vision},
  journal = {American Journal of Traffic and Transportation Engineering},
  volume = {10},
  number = {6},
  pages = {150-167},
  doi = {10.11648/j.ajtte.20251006.12},
  url = {https://doi.org/10.11648/j.ajtte.20251006.12},
  eprint = {https://article.sciencepublishinggroup.com/pdf/10.11648.j.ajtte.20251006.12},
  abstract = {The accurate and objective assessment of reinforced concrete structures is paramount for maintaining structural integrity and optimizing long-term maintenance planning. This study introduces a unified deep learning and computer vision framework designed for the automated detection, classification, and standards-aligned quantitative analysis of concrete cracks. The methodology begins with the automated categorization of an approximately 7,000-image concrete surface dataset into seven specific defect types including Thermal, Serviceability, and Strength Failure Cracks based on geometric metrics like crack length and width. This automated pre-classification step successfully mitigates the subjectivity and inconsistency associated with traditional manual labeling, providing a robust foundation for model training. A Convolutional Neural Network (CNN), implemented using Python, TensorFlow, and Keras, was trained over 50 epochs to detect and classify these categorized defects. The model achieved a final classification accuracy of 91.1%, demonstrating strong generalization and outperforming models trained on unrefined datasets. Following detection, a quantitative damage measurement module utilizes Otsu thresholding, morphological filtering, and skeletonization to precisely extract geometric parameters. Automated functions estimated key crack metrics, including length (5–180mm) and width (0.2–4.5mm), and surface deterioration percentage. These measurements are used to assign a severity grade (minor, moderate, or severe), aligned with established ACI 224R-01 and ACI 318-19 guidelines. Visualization techniques, such as severity-based color coding and multi-panel views, enhance the interpretability and validate both the detection accuracy and measurement reliability. By integrating automated data refinement, CNN-based recognition, and objective standards-aligned quantitative assessment, this framework provides a scalable and reliable tool for real-time structural health monitoring.},
 year = {2025}
}
Copy
|
Download
-
TY  - JOUR
T1  - Quantitative Analysis of Crack Growth and Severity in Reinforced Concrete Structures Using Deep Learning and Computer Vision
AU  - Kalyan Naik Vankudothu
AU  - Wisam Bukaita
Y1  - 2025/12/31
PY  - 2025
N1  - https://doi.org/10.11648/j.ajtte.20251006.12
DO  - 10.11648/j.ajtte.20251006.12
T2  - American Journal of Traffic and Transportation Engineering
JF  - American Journal of Traffic and Transportation Engineering
JO  - American Journal of Traffic and Transportation Engineering
SP  - 150
EP  - 167
PB  - Science Publishing Group
SN  - 2578-8604
UR  - https://doi.org/10.11648/j.ajtte.20251006.12
AB  - The accurate and objective assessment of reinforced concrete structures is paramount for maintaining structural integrity and optimizing long-term maintenance planning. This study introduces a unified deep learning and computer vision framework designed for the automated detection, classification, and standards-aligned quantitative analysis of concrete cracks. The methodology begins with the automated categorization of an approximately 7,000-image concrete surface dataset into seven specific defect types including Thermal, Serviceability, and Strength Failure Cracks based on geometric metrics like crack length and width. This automated pre-classification step successfully mitigates the subjectivity and inconsistency associated with traditional manual labeling, providing a robust foundation for model training. A Convolutional Neural Network (CNN), implemented using Python, TensorFlow, and Keras, was trained over 50 epochs to detect and classify these categorized defects. The model achieved a final classification accuracy of 91.1%, demonstrating strong generalization and outperforming models trained on unrefined datasets. Following detection, a quantitative damage measurement module utilizes Otsu thresholding, morphological filtering, and skeletonization to precisely extract geometric parameters. Automated functions estimated key crack metrics, including length (5–180mm) and width (0.2–4.5mm), and surface deterioration percentage. These measurements are used to assign a severity grade (minor, moderate, or severe), aligned with established ACI 224R-01 and ACI 318-19 guidelines. Visualization techniques, such as severity-based color coding and multi-panel views, enhance the interpretability and validate both the detection accuracy and measurement reliability. By integrating automated data refinement, CNN-based recognition, and objective standards-aligned quantitative assessment, this framework provides a scalable and reliable tool for real-time structural health monitoring.
VL  - 10
IS  - 6
ER  -
Copy
|
Download