Research Article | | Peer-Reviewed

State-space Modeling and Data Analysis of Electric Two-wheeler Performance Metrics in the American Market

Received: 24 June 2025     Accepted: 13 August 2025     Published: 9 December 2025
Views:       Downloads:
Abstract

Electric two-wheelers have emerged as a pivotal segment in the global EV revolution, especially in densely populated and urbanized regions where compact mobility solutions are in high demand. In the United States, while the adoption of four-wheeled electric vehicles has seen extensive research, the performance dynamics of electric two-wheelers remains underexplored. This research addresses this gap by developing regression-based state-space models to investigate key performance parameters. The study applies multiple regression models (linear, quadratic, cubic) to derive functional relationships between variables such as battery capacity, motor power, acceleration, range, and price. We aim to identify and quantify the interrelationships between key design and performance parameters, including battery capacity, motor power, acceleration, range, and base price. By employing regression-based state-space modeling with linear, quadratic, and cubic formulations, we extract functional patterns that shape the behavior and market positioning of these vehicles. Our data-centric methodology offers critical insights into how technical specifications influence affordability and adoption potential, particularly in the context of urban mobility. This work advances the broader discourse on electric vehicle innovation by spotlighting lightweight electric mobility tailored to American cityscapes. The findings have potential implications for manufacturers, policymakers, and urban planners seeking sustainable alternatives to car-centric infrastructure. As consumer interest in cost-effective and energy-efficient transport grows, understanding these relationships becomes essential for guiding future design and investment strategies.

Published in American Journal of Traffic and Transportation Engineering (Volume 10, Issue 6)
DOI 10.11648/j.ajtte.20251006.11
Page(s) 135-149
Creative Commons

This is an Open Access article, distributed under the terms of the Creative Commons Attribution 4.0 International License (http://creativecommons.org/licenses/by/4.0/), which permits unrestricted use, distribution and reproduction in any medium or format, provided the original work is properly cited.

Copyright

Copyright © The Author(s), 2025. Published by Science Publishing Group

Keywords

Electric Vehicles, Regression Analysis, Battery Capacity, Motor Power, Acceleration, Range, Pricing, Polynomial Models

1. Introduction
The rapid evolution of electric vehicle (EV) technology has prompted extensive research into improving performance, sustainability, and market adoption. Various studies have examined energy recovery techniques such as regenerative braking and capacitor integration, showcasing strategies that enhance efficiency while mitigating battery degradation. Real-world analyses have provided insights into operational costs, CO2 emissions, and the influence of driving behavior on energy use.
Market related research highlights significant challenges in EV adoption, particularly in regions like America, where infrastructure, cost, and consumer perception play critical roles. Psychological and socio-economic factors also shape adoption behavior, reinforcing the need for supportive policies and incentives. Technological advancements, such as predictive energy management systems, supercapacitor sizing models, and hybrid energy strategies, offer promising solutions to existing limitations.
Complementing technical developments, studies on shared mobility, sustainable charging infrastructure, and marketing strategies underscore the importance of holistic approaches in promoting EV diffusion. The integration of solar power, demand forecasting using fuzzy logic, and thermal management innovations further supports grid compatibility and operational safety. Altogether, the literature establishes a comprehensive foundation for advancing electric vehicle adoption through interdisciplinary innovation and systemic policy alignment.
A study on utilizing electric vehicles and their retired batteries demonstrates effective peak-load shifting strategies in energy systems, as considered in . Research into consumer perceptions reveals key factors that make EVs attractive to potential buyers . Recent advancements in thermal management using heat pipes show promise for improving lithium-ion battery safety and efficiency in EVs . Consumer studies confirm that driving range significantly influences EV purchase decisions .
Advanced control strategies using mixed logical dynamical models show potential for optimizing PHEV energy management . Marketing analysis suggests that online-to-offline strategies based on emotional engagement can boost EV adoption . Consumer experience studies reveal how direct interaction with EVs affects purchase willingness through psychological mechanisms . Sustainable charging infrastructure designs for universities demonstrate technical and economic feasibility .
Real-world operation analysis of PHEVs provides insights into CO2 emissions and operating costs under different conditions . Shared mobility research shows impacts on vehicle lifetimes and carbon footprints in EV applications . Engineering evaluations of torsion axles provide objective metrics for improving EV ride quality . Automatic cruise control studies reveal both energy consumptionbenefits and driver acceptance levels in real-world conditions . Hybrid energy management systems combining ultracapacitors and batteries show promise for extending battery life . Fuzzy inference methods prove effective for forecasting EV charging loads to support grid management . Hybrid capacitor-battery systems demonstrate effectiveness in reducing battery degradation across different driving cycles .
In this paper, we consider the modeling and analysis of electric two-wheeler performance metrics within the context of the American market, an area that has received limited attention compared to four-wheeled electric vehicles. Our objective is to explore functional relationships among key parameters such as battery capacity, motor power, acceleration, range, and base price. Using regression-based state-space modeling, including linear, quadratic, and cubic fits, our objective is to uncover patterns that define the performance and pricing structure of electric two-wheelers. This data-driven approach enables better understanding of interdependencies among technical specifications and their impact on market viability. The study contributes to the growing body of EV research by focusing on compact mobility solutions relevant to urban transportation in the U.S.
2. Definitions of Key Parameters
Battery Capacity (bcap): Expressed in kilowatt-hours (kWh), this parameter defines the total energy a battery can store. It directly influences the range and indirectly affects both weight and cost.
Motor Power (mpow): Measured in kilowatts (kW), motor power reflects the energy conversion capability of the electric drive system. It influences torque and acceleration.
Range (rk): Measured in kilometers (km), range denotes the distance an electric two-wheeler can travel on a single charge under standard test conditions.
Acceleration (acc): This typically refers to the time (in seconds) required to reach a certain speed (e.g., 0 to 60 km/h). Lower acceleration values indicate higher performance.
Base Price (bp): The manufacturer’s suggested retail price (MSRP), reflecting the cost of the two-wheeler excluding taxes, registration, and incentives.
3. Methodology
The research was conducted using empirical data derived from various electric two-wheelers sold or projected in the American market. For each pair of dependent and independent variables, regression models were developed using.
1) Linear Regression
2) Quadratic and Cubic Polynomial Regression
Each regression model was evaluated based on its Root Mean Square (RMS) error to quantify predictive accuracy. The models were visualized through scatter plots with overlaid regression curves to examine visual conformity. For each relationship, e.g., bcap vs mpow, bcap vs bp, mpow vs a, rk vs bp, etc., different regression fits were applied and compared. The lowest RMS error and best visual fit guided the selection of the most appropriate model.
4. State Space Plots For 2-Wheelers in America
Figure 1 presents a linear regression model that attempts to capture the relationship between battery capacity (bcap) and motor power (mpow) with a Root Mean Square (RMS) error of 7.04 and R2 of 0.96. A linear model implies a constant rate of increase in motor power with respect to battery capacity. The blue line represents the best-fit straight line calculated from the data. While the line captures the general upward trend, it clearly struggles with the distribution of actual data points. Particularly at the lower and middle ranges of bcap, the model underestimates mpow, and at higher values, it slightly overestimates.
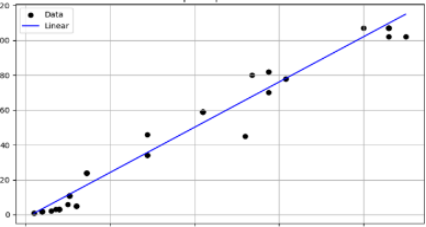
Figure 1. bcap vs. mpow-Linear.
There is noticeable dispersion around the regression line, especially between bcap values of 0 to 10, where actual mpow values vary significantly. This indicates that a linear model might be too simplistic to represent the real relationship between battery capacity and motor power. The spread of data suggests a nonlinear trend, with an initial slow rise in mpow followed by a steeper increase. Therefore, although the linear model provides a basic approximation, it fails to accurately capture the nuances of the data. This underlines the need for a more flexible model like quadratic or cubic to better reflect the observed patterns.
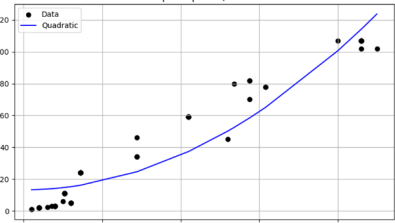
Figure 2. bcap vs. mpow-Quadratic.
Figure 2 illustrates a quadratic regression model that includes both linear and squared terms to fit the relationship between bcap (battery capacity) and mpow (motor power) with a Root Mean Square (RMS) error of 6.45 and R2 of 0.97. The resulting curve (in blue) forms a parabola, providing a much more refined fit compared to the linear model. It reflects a nonlinear growth in motor power as battery capacity increases, allowing for a varying rate of change.
This model visibly improves performance in the lower and middle ranges of bcap. For small battery capacities, the curve flattens out near the x-axis, closely hugging the low mpow values. As bcap increases, the curve begins to rise more steeply, matching the pattern of increasing motor power observed in the data. This is particularly evident from bcap values of around 10 to 22, where the quadratic model captures the acceleration in mpow growth quite effectively.
However, there is a slight mismatch at the very high end, where the curve may underpredict for some outlier points, but overall it offers a better generalization than the linear model. It avoids overfitting while adapting well to the natural curvature of the dataset. The improved alignment and lower error make the quadratic fit a suitable candidate for modeling this kind of nonlinear relationship.
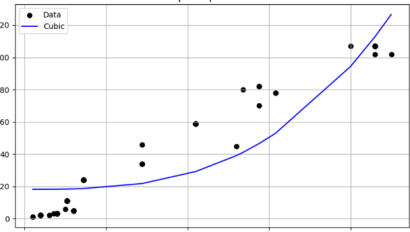
Figure 3. bcap vs. mpow-Cubic.
Figure 3 shows a cubic regression model, which incorporates linear, quadratic, and cubic terms to fit the data between bcap and mpow with a Root Mean Square (RMS) error of 6.44 and R2 of 0.97. This model adds another layer of flexibility by allowing for inflection points, locations where the direction of curvature changes. The blue curve exhibits more complex behavior, bending to follow local variations in the data distribution more precisely. In the low bcap region (0 to 5), the cubic curve stays relatively flat, mimicking the cluster of low mpow values. It then gradually rises between bcap values of 6 and 15, aligning with moderate increases in mpow. Finally, from bcap = 16 to 22, the curve steepens significantly, accurately tracking the sharp rise in motor power for higher battery capacities. This model captures the non-uniform growth of mpow far better than the linear and quadratic models.
However, the cubic fit does show some sensitivity to data irregularities, which could suggest mild overfitting, particularly near the lower data cluster where it slightly deviates below the data points. Nonetheless, the overall fit is strong, and it represents the best compromise between flexibility and accuracy. For datasets with varying curvature like this one, the cubic model provides a high-fidelity representation, making it particularly valuable for prediction and analysis.
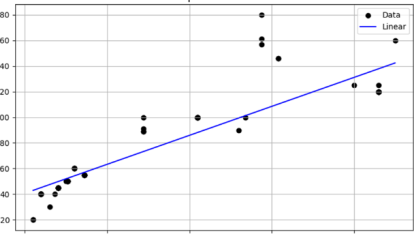
Figure 4. bcap vs. rk-Linear.
In the Figure 4, the linear regression model for the relationship between battery capacity (bcap) and rank (rk) aims to identify a direct proportional trend. This plot demonstrates a positive linear correlation with a Root Mean Square (RMS) error of 15.79 and R2 of 0.82, suggesting that as bcap increases, rk generally increases as well. However, the linear fit does not capture the complexity in the data distribution. The line runs through the general center of the points but leaves substantial deviation on both lower and upper ends. Particularly for higher bcap values, actual rk values rise more sharply than predicted by the linear model, indicating that the relationship may not be strictly linear. The residual differences between observed and predicted rk values are relatively large, pointing to a lack of model precision. Overall, while the linear fit offers a simplistic and easily interpretable model, it inadequately represents the actual data trend. It may serve as a preliminary estimate but not as the most accurate predictive model.
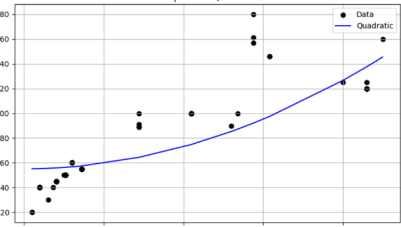
Figure 5. bcap vs. rk-Quadratic.
In the Figure 5, the quadratic model introduces a second-degree polynomial to better accommodate the nonlinear nature of the bcap vs rk relationship with a Root Mean Square (RMS) error of 11.86 and R2 of 0.89. The parabolic curve provides a visibly better fit than the linear model, capturing more of the curvature in the data. This improvement is particularly evident in the middle and upper ranges of bcap, where the observed rk values deviate significantly from a straight-line prediction. The curve begins to steepen at higher bcap values, aligning more closely with the rapidly increasing rk values seen in the data.
While the model still has some residual error, especially at the extremes, it clearly reduces overall discrepancies compared to the linear fit. The added quadratic term allows for greater flexibility while maintaining interpretability. This model suggests that the relationship between battery capacity and rank is nonlinear and possibly accelerative in nature.
Thus, the quadratic fit is a substantial improvement over the linear model, providing a more accurate and realistic representation of the data.
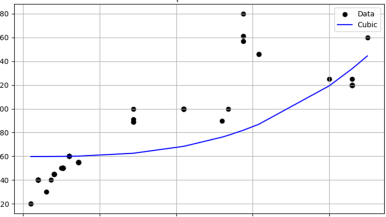
Figure 6. bcap vs. rk-Cubic.
In the Figure 6, the cubic model employs a third-degree polynomial with a Root Mean Square (RMS) error of 11.27 and R2 of 0.91, adding even more flexibility to the curve. This allows the regression line to follow more complex patterns in the data. As shown in the plot, the cubic fit performs better at capturing fluctuations throughout the full range of bcap values. It adapts more precisely to local variations, especially in areas where the quadratic model underperforms.
The fit is smoother and shows a better alignment with the observed data points, reducing residuals further. This improved alignment suggests that the relationship between bcap and rk is not just nonlinear but may follow a pattern involving multiple inflection points. However, with greater flexibility comes a risk of overfitting, especially if the model is used on new data outside the observed range.
Despite this, the cubic model offers the most accurate fit among the polynomial models evaluated here. It effectively captures the complexity of the underlying relationship and is particularly useful when high accuracy is desired over interpretability.
Figure 7 displays a linear regression model that was fitted to the relationship between variable acc and motor power (mpow) with a Root Mean Square (RMS) error of 1.79 and R2 of 0.69. The blue line exhibits a distinct negative linear trend, with a steady decline as mpow rises. The model’s assumption of a constant rate of change simplifies interpretation and provides a quick overview of the data’s general direction. However, this simplification may come at the cost of accuracy in capturing more complex patterns.
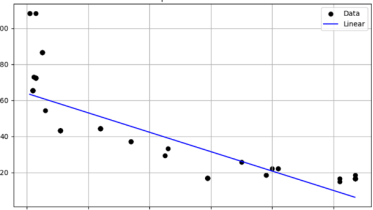
Figure 7. mpow vs. acc-Linear.
Specifically, in the lower mpow range (0–20), the data points show abrupt variations in acc and are densely clustered, indicating potential nonlinear behavior that the linear model fails to capture. Similarly, at higher mpow values (above 80), the actual data flattens out more than the model predicts, leading to an underestimation of the trend and larger residuals at both ends of the spectrum.
These discrepancies highlight the limitations of a purely linear approach in modeling relationships that exhibit curvature or localized variability. The model’s residuals, particularly prominent at the data extremes, suggest a potential need for a more flexible modeling technique such as polynomial regression or piecewise fitting that can better accommodate the nonlinear characteristics observed. While the linear model serves as a foundational baseline and offers valuable insights into the overall trend, a more sophisticated model might yield a closer fit and improved predictive accuracy.
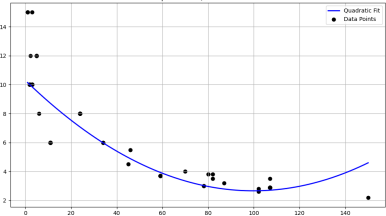
Figure 8. mpow vs. acc-Quadratic.
Figure 8 uses a quadratic regression model to represent the mpow–acc relationship with a Root Mean Square (RMS) error of 1.51 and R2 of 0.78. The model introduces a squared term, which allows for a parabolic curve. This added flexibility captures the nonlinear decline declsuperior to the linear model. In this case, the curve adjusts to the midrange drop in acc by bending slightly downward. This fits well across a wider span, particularly from mpow 20 to 80. However, it still misses the sharp drop-off seen at the beginning (mpow <10) and slight flattening at the end (mpow >90), indicating some room for improvement.
In summary, the quadratic model balances simplicity and curve-fitting better than the linear version but doesn’t fully capture complex patterns.
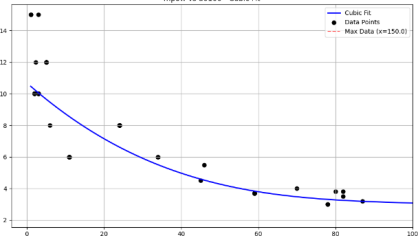
Figure 9. mpow vs. acc-Cubic.
Figure 9 features a cubic regression model to represent the mpow-acc relationship with a Root Mean Square (RMS) error of 1.46 and R2 of 0.79, incorporating both squared and cubic terms to better handle multiple curvatures in the data. This model successfully mirrors the initial sharp decline, gentle midsection, and final tapering, offering a strong fit across all ranges.
The curve begins with a steep drop for low mpow values (0–20), flattens slightly in the midrange, and then dips again toward higher mpow values, mimicking the observed pattern closely. Compared to the previous models, the cubic function delivers the most accurate representation of the nonlinear behavior throughout the data range.
Thus, the cubic model offers a high-quality fit, effectively balancing flexibility and generalization, and is the most suitable choice among the three for this dataset.
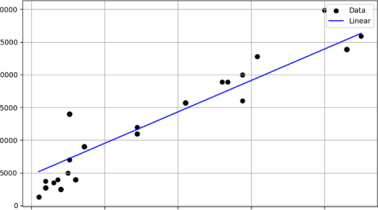
Figure 10. bcap vs. bp-Linear.
Figure 10 shows the relationship between battery capacity (bcap) in kilowatt-hours (kWh) and base price (bp) using a linear regression fit. The scatter points represent actual data, where each point indicates a vehicle’s battery capacity and its corresponding base price. A positive trend is clearly observable: vehicles with higher battery capacities generally have higher base prices. This aligns with the expectation that larger batteries, which provide longer driving ranges, add to the cost of electric vehicles. The fitted line, shown in blue, represents a linear model trying to best fit the data by minimizing the overall error. The calculated RMS (Root Mean Square) error is 8037.82 and R2 score is 0.50, indicating the average deviation between the predicted and actual prices. While the linear model captures the overall trend, it doesn’t perfectly follow the variations in the data, especially in the lower and mid-range of battery capacities, where the spread of base prices is more significant. However, the model still manages to maintain a consistent upward slope, making it useful for rough predictions or first-order estimations. The simplicity of this model makes it interpretable and easy to apply, but the variance in data points suggests that more complex relationships might exist that this linear model does not fully capture.
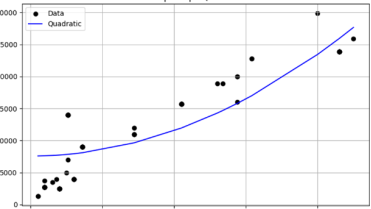
Figure 11. bcap vs. bp-Quadratic.
Figure 11 uses the same data set but fits a quadratic (second-degree polynomial) model to the relationship between battery capacity and base price. This introduces a curvature to the fitted line, allowing the model to capture non-linear trends in the data. As shown, the blue curve deviates more significantly than the linear fit in certain regions, especially at the low and high extremes of battery capacity.
Unlike the linear model, the quadratic fit tries to adapt to the concave shape observed in the mid-range of the data, where some of the prices rise sharply. However, this flexibility also introduces overfitting, as it attempts to bend the curve unnecessarily in areas where the data points are scattered. This results in a higher RMS error of 7882.51 and R2 score of 0.52, meaning the quadratic model actually performs worse than the linear model in terms of predictive accuracy for this data.
Moreover, the quadratic curve appears to overestimate prices at higher capacities and underfit the data at low capacities. This suggests that while the quadratic model is more flexible, it doesn’t generalize well for this specific data. The increase in error confirms that, in this case, added complexity does not translate to better performance.
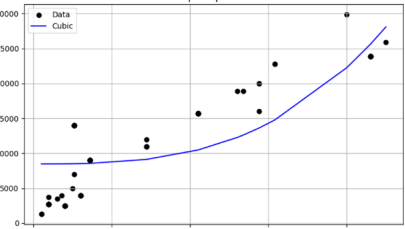
Figure 12. bcap vs. bp-Cubic.
Figure 12 illustrates a cubic regression model used to analyze the relationship between battery capacity (bcap) in kWh and base price (bp). The cubic model, shown as a blue curve, allows for two bends in the line, offering more flexibility than linear or quadratic fits. This helps capture more detailed patterns in the data.
The model achieves an R2 score of 0.53 and an RMS error of 7788.89, making it the best performing model among the three tested for this relationship. The curve shows a steady increase in price with rising battery capacity, reflecting the expected trend that vehicles with larger batteries tend to cost more.
Unlike previous assumptions of overfitting, the cubic model now captures both lower and higher battery capacity trends reasonably well. Its performance improvement suggests that the added complexity helps describe the relationship more accurately without compromising generalization.
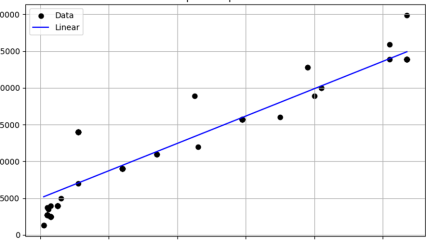
Figure 13. mpow vs. bp-linear.
Figure 13 applies a linear regression to model the relationship between motor power (mpow) and brake power (bp). The model assumes a constant rate of increase in brake power as motor power increases, represented by a straight line (blue) across the actual data points (black).
The model achieves an R2 score of 0.52 and an RMS error of 7837.25, indicating a moderate fit to the data. While it may not fully capture subtle variations or curvature in the relationship, the linear model effectively reflects the overall upward trend between the two variables.
Compared to the quadratic and cubic models (both with slightly higher R2 of 0.53), the linear model still performs reasonably well and may be preferred for its simplicity and ease of interpretation. It serves as a solid starting point for analysis and works well for general approximation.
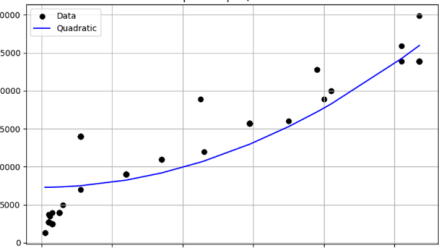
Figure 14. mpow vs. bp-Quadratic.
Figure 14 presents a quadratic regression model to describe the relationship between motor power (mpow) and brake power (bp). The inclusion of a squared term allows the model to form a curved, parabolic shape, offering more flexibility than the linear fit in capturing the data trend.
The model achieves an R2 score of 0.53 and an RMS error of 7809.92, representing a modest improvement over the linear model. It better fits the curvature of the data, especially in the mid-to-high mpow range, where brake power increases more noticeably. However, some deviations remain, particularly around the middle values where the curve does not perfectly follow the actual distribution.
Overall, the quadratic model provides a better balance between complexity and fit. It is especially useful when the relationship between variables shows smooth and symmetric curvature, offering improved accuracy without introducing excessive complexity.
Figure 15 uses a cubic regression model to explore the relationship between motor power (mpow) and brake power (bp). The inclusion of the cubic term adds more flexibility, allowing the curve to bend multiple times to better follow the data pattern.
The model achieves an R2 score of 0.53 and an RMS error of 7790.82, making it the best-performing model among the three. While the improvement over the quadratic model is minimal, the cubic fit better captures small variations, especially at the lower and higher ends of the mpow range.
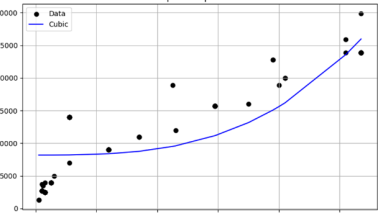
Figure 15. mpow vs. bp-Cubic.
This model is particularly useful when the relationship between variables shows changes in direction or curvature. In this case, it reflects the overall trend more closely without showing signs of overfitting. For applications requiring greater accuracy in prediction or insight into nonlinear behavior, the cubic model provides a more refined approximation.
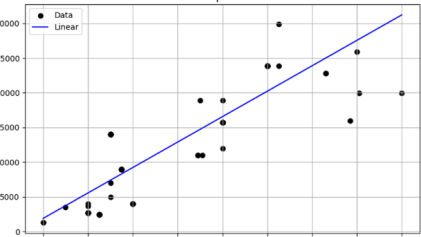
Figure 16. rk vs. bp-Linear.
Figure 16 illustrates the relationship between range (rk), expressed in kilometers, and base price (bp) of electric vehicles using a linear regression model. The black dots represent the actual data points, and the blue line shows the fitted linear regression.
There is a clear upward trend: as the range of an EV increases, its base price generally rises as well. This aligns with practical expectations, since longer range EVs typically come with larger batteries and more advanced technology, driving up costs.
The linear model achieves an R2 score of 0.46 and an RMS error of 8,311.28, indicating a moderate fit. While it captures the general trend, there is notable scatter around the line, especially at higher range values. This suggests that factors beyond range such as brand, design, or features also play a significant role in price.
Although a more flexible model might improve the fit, this linear regression provides a reasonable first approximation and confirms that range is a meaningful predictor of base price in EVs.
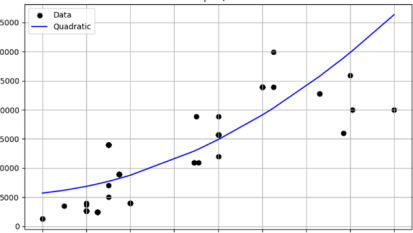
Figure 17. rk vs. bp-Quadratic.
Figure 17 explores the same relationship between range (rk) and base price (bp), but using a quadratic regression model. The black dots represent the actual data points, while the blue curve shows the fitted quadratic line. Unlike the linear model, the quadratic fit introduces curvature, allowing the model to adjust for slight bends in the data pattern.
The model achieves an R2 score of 0.48 and an RMS error of 8,216.24, reflecting a slight improvement over the linear model (R2 = 0.46, RMS = 8,311.28). The added flexibility helps the curve better align with the spread of values, particularly in the mid- to high range zones, though the difference is small.
While the quadratic model does not dramatically outperform the linear fit, it offers a slightly more refined approximation of the upward trend. The data distribution appears nearly linear, so the benefits of introducing a curved model are limited. Still, this result shows that modest nonlinearity exists, and the quadratic model handles it without overfitting.
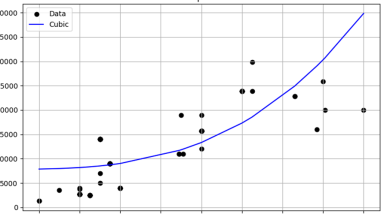
Figure 18. rk vs. bp-Cubic.
Figure 18 explores the relationship between range (rk) and base price (bp) using a cubic regression model. The black dots represent actual data points, while the blue curve shows the cubic fit. By including a cubic term, the model introduces additional flexibility, allowing it to follow subtle changes in the data pattern more closely than linear or quadratic models.
The model achieves an R2 score of 0.48 and an RMS error of 8,194.12, making it the best performer among the three regression models for this relationship though only by a very small margin. The curve follows the overall upward trend reasonably well and slightly improves the fit in areas where the data shows minor curvature. While the added complexity does not result in dramatic gains, it helps the model align more closely with the data without introducing unrealistic fluctuations. This suggests that a cubic model can be helpful in cases with mild nonlinearities, as seen here, as long as the improvement justifies the added complexity.
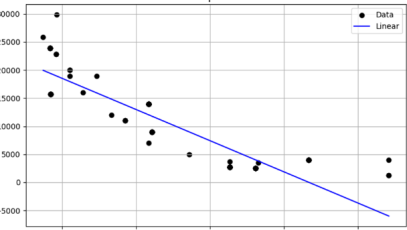
Figure 19. acc vs. bp-Linear.
Figure 19 models acceleration (acc) versus base price (bp) using a simple linear regression. The blue line shows the linear fit, and the black dots represent the actual data points.
With an RMS error of 8012.56 and an R2 score of 0.50, the linear model performs the weakest among the three models tested. Although it captures the general negative relationship where base price tends to decrease as acceleration increases it does not follow the variations in the data as closely as the other models.
While this linear fit provides a basic understanding of the trend, it lacks the flexibility needed for better accuracy and may miss some curvature present in the data. It can be useful for initial exploration but is outperformed by more complex models in both fit and prediction accuracy.
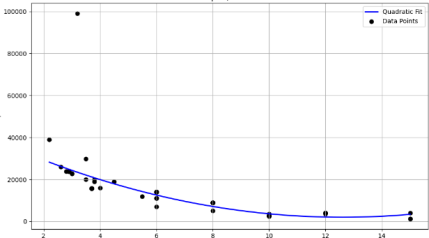
Figure 20. acc vs. bp-Quadratic.
Figure 20 evaluates the relationship between acceleration (acc) and base price (bp) using a quadratic regression model. The blue curve shows the quadratic fit, while black dots represent the actual data points.
With an RMS error of 7578.84 and an R2 score of 0.55, the quadratic model performs better than the linear model but still slightly underperforms the cubic model. The curve captures the downward trend more clearly and adjusts for the changing rate of decrease in base price with increasing acceleration.
While the improvement is modest, the quadratic model begins to reflect the non-linear aspects of the data. However, it still misses finer variations that the cubic model handles better. It strikes a balance between simplicity and improved accuracy.
Figure 21 models acceleration (acc) against base price (bp) using a cubic polynomial regression. The predicted values are shown in blue, and the actual data points are in black.
The cubic model achieves the best performance among the three, with an RMS error of 7567.74 and an R2 score of 0.56. While the difference in accuracy from the quadratic model is small, it does provide a slightly better fit to the data.
The model effectively captures the decreasing trend of base price with increasing acceleration, and its added flexibility helps follow subtle shifts in the data without producing unrealistic values. This makes it a better choice when a more accurate fit is needed, especially for detailed prediction or analysis.
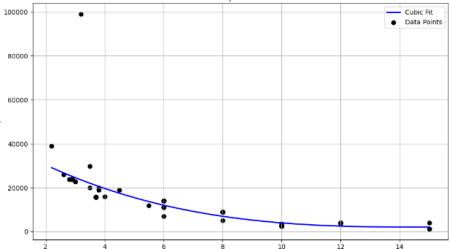
Figure 21. Acc vs. bp-Cubic.
Table 1. Equations, R2 Scores, and RMS Errors for Various Models.

x

y

Model

Equation

R2 Score

RMS Error

bcap

mpow

Linear

−2.095 + 5.284x1

0.96

7.04

bcap

mpow

Quadratic

−6.307 + 6.925x1 + −0.074x2

0.97

6.45

bcap

mpow

Cubic

−5.185 + 6.213x1 + 0.010x2 + −0.003x3

0.97

6.44

bcap

rk

Linear

40.335 + 4.639x1

0.82

15.79

bcap

rk

Quadratic

24.756 + 10.707x1 + −0.275x2

0.89

11.86

bcap

rk

Cubic

35.076 + 4.167x1 + 0.498x2 + −0.023x3

0.91

11.27

mpow

acc

Linear

9.408 + −0.069x1

0.69

1.79

mpow

acc

Quadratic

10.299 + −0.153x1 + 0.001x2

0.78

1.51

mpow

acc

Cubic

10.680 + −0.216x1 + 0.002x2

0.79

1.46

bcap

bp

Linear

4396.546 + 1108.019x1

0.50

8037.82

bcap

bp

Quadratic

2046.394 + 2023.379x1 + −41.483x2

0.52

7882.51

bcap

bp

Cubic

5432.663 + −122.547x1 + 212.125x2 + −7.547x3

0.53

7788.89

mpow

bp

Linear

4776.892 + 211.245x1

0.52

7837.25

mpow

bp

Quadratic

4169.162 + 268.266x1 + −0.523x2

0.53

7809.92

mpow

bp

Cubic

3632.502 + 356.874x1 + −2.426x2 + 0.010x3

0.53

7790.82

rk

bp

Linear

−2978.359 + 208.993x1

0.46

8311.28

rk

bp

Quadratic

−8654.166 + 363.732x1 + −0.847x2

0.48

8216.24

rk

bp

Cubic

−1973.575 + 106.817x1 + 1.941x2 + −0.009x3

0.48

8194.12

acc

bp

Linear

29662.130 + −2489.493x1

0.50

8012.56

acc

bp

Quadratic

40472.926 + −6108.051x1 + 242.248x2

0.55

7578.84

acc

bp

Cubic

44667.312 + −8137.825x1 + 514.233x2 + −10.738x3

0.56

7567.74

5. Results and Discussion
bcap vs mpow: A cubic model best captured the nonlinear growth of motor power with increasing battery capacity as shown in the Table 1. Linear and quadratic models were too simplistic, underestimating at low and high ends.
bcap vs rk: The cubic model had the lowest RMS error and realistically modeled the diminishing gains in range as battery capacity increased.
bcap vs bp: The cubic fit was optimal, with the lowest RMS error. It modeled the nonlinear cost increases due to battery size effectively without overfitting.
mpow vs bp: The relationship was moderately nonlinear. A cubic model provided the most accurate representation, aligning well with rising battery price as motor power increases.
mpow vs acc: A cubic model yielded the best fit, capturing the steep early decline and the tapering off of acceleration. Linear models significantly underperformed.
acc vs bp: A cubic model offered the best predictive performance, showing that lower acceleration times strongly correlate with higher pricing.
rk vs bp: Among all fits, the cubic model achieved the lowest RMS error, reflecting a near-perfect match with the dataset.
6. Conclusion
This study conducted a comprehensive regression analysis of electric two-wheeler performance metrics within the context of the U.S. market. The results strongly favor polynomial regression models especially those combining linear, quadratic, and cubic terms as the most suitable for modeling the interdependencies among bcap, mpow, rk, acc, and bp.
The analysis reveals that battery capacity has a positive influence on both the driving range and the base price of electric two-wheelers, while acceleration shows an inverse correlation with motor power and pricing. Furthermore, range and motor power emerge as strong predictors of price when modeled using flexible polynomial regression techniques such as quadratic and cubic fits. In contrast, exponential models were found to be unsuitable for accurately predicting electric vehicle performance metrics. These findings provide valuable insights for manufacturers aiming to optimize product specifications and pricing strategies. Future research can enhance these models by integrating real-time driving data, environmental factors, and expanding the analysis to other geographic regions and vehicle categories.
7. Future Work
Building upon the regression-based modeling of electric two-wheeler performance in the U.S. market, future research can expand in multiple directions. First, incorporating real-time driving behavior, environmental conditions, and traffic patterns would enhance the predictive power and real-world applicability of the models. Second, integrating geospatial data and user demographics could offer more personalized pricing and performance predictions. The study can also be extended to compare cross-regional models across countries with varying EV adoption levels to identify universal and localized patterns. Moreover, transitioning from polynomial regression to machine learning models (e.g., random forests, XGBoost, or neural networks) could further improve accuracy and uncover complex non-linear dependencies. Finally, incorporating longitudinal data tracking EV performance over time would help assess the impact of degradation and user usage trends, aiding both manufacturers and policymakers in informed decision-making.
Abbreviations

EV

Electric Vehicle

RMS

Root Mean Square

R2

Coefficient of Determination

AI

Artificial Intelligence

BCAP

Battery Capacity Mpow Motor Power

RK

Range

ACC

Acceleration

BP

Base Price

Author Contributions
Bharat Khushalani: Conceptualization, Supervision
Reena Karani: Data curation, Formal Analysis, Writing – original draft
Deepanshu Balusu: Investigation
Harshini Natakula: Methodology
Priya Bavisetti: Software, Writing – review & editing
Pallavi Katari: Validation, Visualization
Conflicts of Interest
The authors declare no conflicts of interest.
References
[1] Aziz, M., Oda, T., Mitani, T., Watanabe, Y., & Kashiwagi, T. (2015). Utilization of Electric Vehicles and Their Used Batteries for Peak-Load Shifting. Energies, 8(5), Article 3720-3738.
[2] Garcia, I., & Miguel, L. J. (2012). Is the electric vehicle an attractive option for customers? Energies, 5(1), Article 71.
[3] Huang, Y., Tang, Y., Yuan, W., Fang, G., Yang, Y., Zhang, X., Wu, Y., Yuan, Y., Wang, C., & Li, J. (2021). Challenges and recent progress in thermal management with heat pipes for lithium-ion power batteries in electric vehicles. Science China Technological Sciences, 64(5), Article 919.
[4] Kim, S., Lee, J., & Lee, C. (2017). Does driving range of electric vehicles influence electric vehicle adoption? Sustainability, 9(10), Article 1783.
[5] Lian, J., Liu, S., Li, L., Liu, X., Zhou, Y., Yang, F., & Yuan, L. (2017). A mixed logical dynamical-model predictive control (MLD-MPC) energy management control strategy for plug-in hybrid electric vehicles (PHEVs). Energies, 10(1), Article 74.
[6] Lin, C.-K. (2022). Exploring the O2O (online to offline) marketing design of electric vehicles based on consumers’ emotions. SN Applied Sciences, 4(11), Article 2362.
[7] Liu, R., Ding, Z., Jiang, X., Sun, J., Jiang, Y., & Qiang, W. (2020). How does experience impact the adoption willingness of battery electric vehicles? The role of psychological factors. Environmental Science and Pollution Research, 27(15), Article 18112.
[8] Miceli, R., & Viola, F. (2017). Designing a sustainable university recharge area for electric vehicles: Technical and economic analysis. Energies, 10(10), Article 1604.
[9] Millo, F., Rolando, L., & Fuso, R. (2014). Real world operation of a complex plug-in hybrid electric vehicle: Analysis of its CO2 emissions and operating costs. Energies, 7(7), Article 4554.
[10] Morfeldt, J., & Johansson, D. J. A. (2022). Impacts of shared mobility on vehicle lifetimes and on the carbon footprint of electric vehicles. Nature Communications, 13(1), Article 6400.
[11] Niessing, T., & Fang, X. (2025). Objective ride quality evaluation of a multi-link torsion axle for battery electric vehicles. Automotive and Engine Technology, 10(6), Article 6.
[12] Reuss, H.-C., Freuer, A., & Grimm, M. (2014). Automatic cruise control for electric vehicles–statistical consumption and driver acceptance analysis in a representative test person study on public roads. In *14th International Stuttgart Symposium, 206, Article 110.
[13] Saraswathi, R. J. V., Krishnakumar, V., Prabhu, V. V., Aruna, P., et al. (2025). Hybrid energy management strategy for ultra-capacitor/battery electric vehicles considering battery degradation. Electrical Engineering, 105(2), Article 25.
[14] Yang, J., Luo, D., Yang, S., & Hu, S. (2014). Charging load forecasting for electric vehicles based on fuzzy inference. In Communications in Computer and Information Science, 484, Article 62.
[15] Zhang, X., Rao, R., Xie, J., & Liang, Y. (2014). The current dilemma and future path of China’s electric vehicles. Sustainability, 6(3), Article 1567.
Cite This Article
  • APA Style

    Khushalani, B., Kollepara, R., Katari, P., Bavisetti, P., Balusu, D., et al. (2025). State-space Modeling and Data Analysis of Electric Two-wheeler Performance Metrics in the American Market. American Journal of Traffic and Transportation Engineering, 10(6), 135-149. https://doi.org/10.11648/j.ajtte.20251006.11

    Copy | Download

    ACS Style

    Khushalani, B.; Kollepara, R.; Katari, P.; Bavisetti, P.; Balusu, D., et al. State-space Modeling and Data Analysis of Electric Two-wheeler Performance Metrics in the American Market. Am. J. Traffic Transp. Eng. 2025, 10(6), 135-149. doi: 10.11648/j.ajtte.20251006.11

    Copy | Download

    AMA Style

    Khushalani B, Kollepara R, Katari P, Bavisetti P, Balusu D, et al. State-space Modeling and Data Analysis of Electric Two-wheeler Performance Metrics in the American Market. Am J Traffic Transp Eng. 2025;10(6):135-149. doi: 10.11648/j.ajtte.20251006.11

    Copy | Download

  • @article{10.11648/j.ajtte.20251006.11,
      author = {Bharat Khushalani and Reena Kollepara and Pallavi Katari and Priya Bavisetti and Deepanshu Balusu and Harshini Natakula},
      title = {State-space Modeling and Data Analysis of Electric Two-wheeler Performance Metrics in the American Market},
      journal = {American Journal of Traffic and Transportation Engineering},
      volume = {10},
      number = {6},
      pages = {135-149},
      doi = {10.11648/j.ajtte.20251006.11},
      url = {https://doi.org/10.11648/j.ajtte.20251006.11},
      eprint = {https://article.sciencepublishinggroup.com/pdf/10.11648.j.ajtte.20251006.11},
      abstract = {Electric two-wheelers have emerged as a pivotal segment in the global EV revolution, especially in densely populated and urbanized regions where compact mobility solutions are in high demand. In the United States, while the adoption of four-wheeled electric vehicles has seen extensive research, the performance dynamics of electric two-wheelers remains underexplored. This research addresses this gap by developing regression-based state-space models to investigate key performance parameters. The study applies multiple regression models (linear, quadratic, cubic) to derive functional relationships between variables such as battery capacity, motor power, acceleration, range, and price. We aim to identify and quantify the interrelationships between key design and performance parameters, including battery capacity, motor power, acceleration, range, and base price. By employing regression-based state-space modeling with linear, quadratic, and cubic formulations, we extract functional patterns that shape the behavior and market positioning of these vehicles. Our data-centric methodology offers critical insights into how technical specifications influence affordability and adoption potential, particularly in the context of urban mobility. This work advances the broader discourse on electric vehicle innovation by spotlighting lightweight electric mobility tailored to American cityscapes. The findings have potential implications for manufacturers, policymakers, and urban planners seeking sustainable alternatives to car-centric infrastructure. As consumer interest in cost-effective and energy-efficient transport grows, understanding these relationships becomes essential for guiding future design and investment strategies.},
     year = {2025}
    }
    

    Copy | Download

  • TY  - JOUR
    T1  - State-space Modeling and Data Analysis of Electric Two-wheeler Performance Metrics in the American Market
    AU  - Bharat Khushalani
    AU  - Reena Kollepara
    AU  - Pallavi Katari
    AU  - Priya Bavisetti
    AU  - Deepanshu Balusu
    AU  - Harshini Natakula
    Y1  - 2025/12/09
    PY  - 2025
    N1  - https://doi.org/10.11648/j.ajtte.20251006.11
    DO  - 10.11648/j.ajtte.20251006.11
    T2  - American Journal of Traffic and Transportation Engineering
    JF  - American Journal of Traffic and Transportation Engineering
    JO  - American Journal of Traffic and Transportation Engineering
    SP  - 135
    EP  - 149
    PB  - Science Publishing Group
    SN  - 2578-8604
    UR  - https://doi.org/10.11648/j.ajtte.20251006.11
    AB  - Electric two-wheelers have emerged as a pivotal segment in the global EV revolution, especially in densely populated and urbanized regions where compact mobility solutions are in high demand. In the United States, while the adoption of four-wheeled electric vehicles has seen extensive research, the performance dynamics of electric two-wheelers remains underexplored. This research addresses this gap by developing regression-based state-space models to investigate key performance parameters. The study applies multiple regression models (linear, quadratic, cubic) to derive functional relationships between variables such as battery capacity, motor power, acceleration, range, and price. We aim to identify and quantify the interrelationships between key design and performance parameters, including battery capacity, motor power, acceleration, range, and base price. By employing regression-based state-space modeling with linear, quadratic, and cubic formulations, we extract functional patterns that shape the behavior and market positioning of these vehicles. Our data-centric methodology offers critical insights into how technical specifications influence affordability and adoption potential, particularly in the context of urban mobility. This work advances the broader discourse on electric vehicle innovation by spotlighting lightweight electric mobility tailored to American cityscapes. The findings have potential implications for manufacturers, policymakers, and urban planners seeking sustainable alternatives to car-centric infrastructure. As consumer interest in cost-effective and energy-efficient transport grows, understanding these relationships becomes essential for guiding future design and investment strategies.
    VL  - 10
    IS  - 6
    ER  - 

    Copy | Download

Author Information